







Contenido

Pintar Industria
The Practical Guide to Surface Science (2026)

D54c15105cfe94f786c500e4091d6ea65457608fde49ba183c8f862814a54249?s=100&d=m
Escrito por
Dr. Amit Pratap Singh
PhD, Delhi University Post Doc - AIST Japan
Guest Author
leer más
alidad
Reviewed by
Dr. Alidad Amirfazli
Dr. Amirfazli, a leading expert in surface wetting and superhydrophobic coatings, has 250+ publications, edits Advances in Colloid and Interface Science, and has received multiple research awards.
Scientific Advisor & Co-founder
leer más
D54c15105cfe94f786c500e4091d6ea65457608fde49ba183c8f862814a54249?s=100&d=m
Written By

Dr. Amit Pratap Singh

Guest Author

PhD, Delhi University

Post Doc - AIST Japan

alidad
Reseña escrita por

Dr. Alidad Amirfazli

Scientific Advisor & Co-founder

Dr. Amirfazli, a leading expert in surface wetting and superhydrophobic coatings, has 250+ publications, edits Advances in Colloid and Interface Science, and has received multiple research awards.

This is a practical guide to Surface Science for researchers working in the Paint Industry.

En esta nueva guía aprenderás todo sobre:

  • Principios cruciales de la ciencia de superficies
  • The significance of surface science measurements for the Paint industry
  • Normas y directrices ASTM aplicables

Vamos a sumergirnos en ello.

Pintar

Executive Summary

What it covers: A practical, paint-industry guide to measuring and using four core surface properties—contact angle (static + advancing/receding), surface tension (static + dynamic), surface energy, and sliding angle—to improve adhesion, durability, appearance, and process consistency. It also includes benchmark droplet references, real-world paint case studies, and a standards-based workflow for repeatable R&D and QC.
Key insights: Real coatings show contact-angle hysteresis, so advancing/receding angles give a more reliable picture than a single static value; Young–Laplace fitting is typically more consistent while polynomial fits can handle non-axisymmetric drops but are more sensitive to imperfections. Dynamic surface tension is the right tool when interfaces evolve quickly (droplet/bubble formation, foams, and paint drying), and surface free energy results should be treated as conditional on a locked liquid set, timing, volume, and analysis model—best interpreted via trends vs a baseline and variability across spots.
Business value: The measurement playbook helps paint teams screen formulations and surface prep faster (wetting, leveling, defect risk, and additive compatibility), catch process drift earlier, and triage root causes with fewer costly downstream failures. Practically, it reduces rework/scrap and accelerates optimization of surfactants/rheology modifiers/coupling agents to improve adhesion and defect control—illustrated by a nanocellulose–surfactant compatibility example and field-style scenarios (metal peeling, glass fogging/streaking, concrete durability).
Standards to follow: Use ISO 19403-2:2024 to determine surface free energy from optical contact-angle measurements and to standardize what you report (surface description, liquids, droplet volume, timing, replicates, fitting/QC rules, and the chosen SFE model/outputs). Pair it with relevant ASTM/ISO practices your lab already controls for contact angle, surface tension, and sliding/roll-off behavior, and set QC limits only after correlating angle/SFE trends to “truth metrics” like adhesion tests and defect rates.
Bottom line: This is a standards-aligned, execution-focused guide showing what to measure, when to measure it, and how to interpret it so surface data becomes a defensible decision tool for formulation, pretreatment readiness, and troubleshooting. If you lock protocols, use the included benchmarks as sanity checks, and trend both the median and variability, you’ll turn surface science into faster and more reliable paint performance outcomes.

Capítulo 1: Introducción

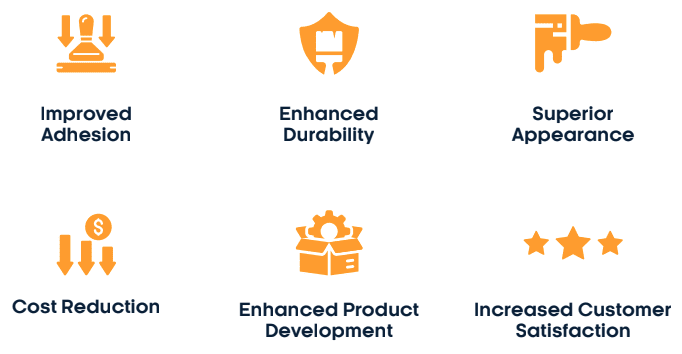
Paint manufacturers actively strive to determine the adhesion, durability, and appearance of their products. This relentless pursuit of quality drives them to leverage surface property measurements. By meticulously analyzing these measurements, they continuously improve paint performance and guarantee it meets customer expectations. 


Screenshot 2024 06 25 at 7.12.17 AM

We use the following surface properties to understand the behavior of Paint products and improve their quality.

Capítulo 2: Medición del ángulo de contacto

El ángulo de contacto cuantifica la humectabilidad de una superficie representando el ángulo entre la superficie de un líquido y una superficie sólida.
Investigación de Dropletlab

Sample Image taken from Droplet Lab Tensiometer.

Joven – Método Laplace

Método polinómico

Ángulo de contacto dinámico

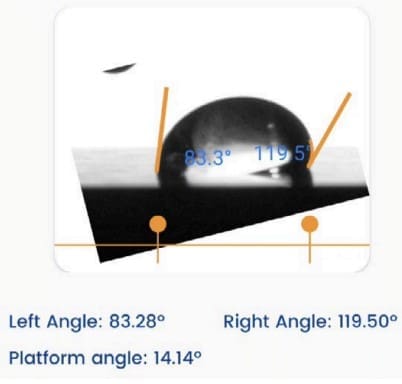
Ideally, when we place a drop on a solid surface, a unique angle exists between the liquid and the solid surface. We can calculate the value of this ideal contact angle (the so-called Young’s contact angle) using Young’s equation. In practice, due to surface geometry, roughness, heterogeneity, contamination, and deformation, the contact angle value on a surface is not necessarily a single consistent value but rather falls within a range. The upper and lower limits of this range are known as the advancing and receding contact angles, respectively. The values of advancing and receding contact angles for a solid surface are highly sensitive to many parameters, such as temperature, humidity, homogeneity, and minor contamination of the surface and liquid. For example, the advancing and receding contact angles of a surface can differ at different locations.

Ángulo de contacto dinámico frente a ángulo de contacto estático

Las superficies y los recubrimientos prácticos muestran naturalmente histéresis de ángulo de contacto, lo que indica un rango de valores de equilibrio. Cuando medimos ángulos de contacto estáticos, obtenemos un solo valor dentro de este rango. Confiar únicamente en mediciones estáticas plantea problemas, como una repetibilidad deficiente y una evaluación incompleta de la superficie con respecto a la adherencia, la limpieza, la rugosidad y la homogeneidad.

In practical applications, we need to understand how easily a liquid spreads (advancing angle) and how easily it is removed (receding angle), such as in painting and cleaning. Measuring advancing and receding angles offers a holistic view of liquid-solid interaction, unlike static measurements, which yield an arbitrary value within the range.

Esta información es crucial para las superficies del mundo real con variaciones, rugosidad y dinámica, lo que ayuda a industrias como la cosmética, la ciencia de los materiales y la biotecnología a diseñar superficies efectivas y optimizar los procesos.

Aprenda cómo se realiza la medición del ángulo de contacto en nuestro tensiómetro

Para una comprensión más completa de la medición del ángulo de contacto, lea nuestra medición del ángulo de contacto: la guía definitiva

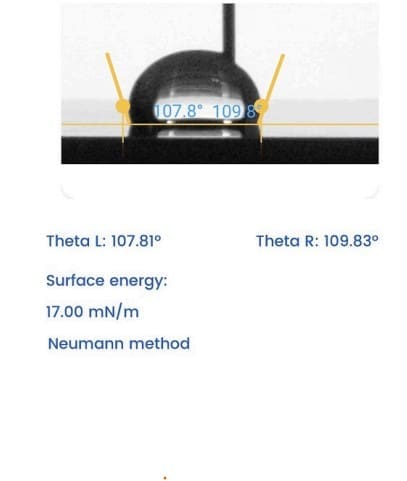
Open Benchmark Data: Contact Angle & Surface Energy

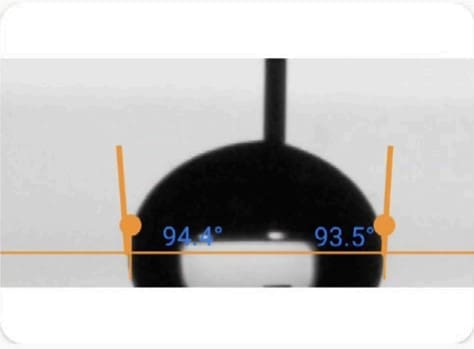
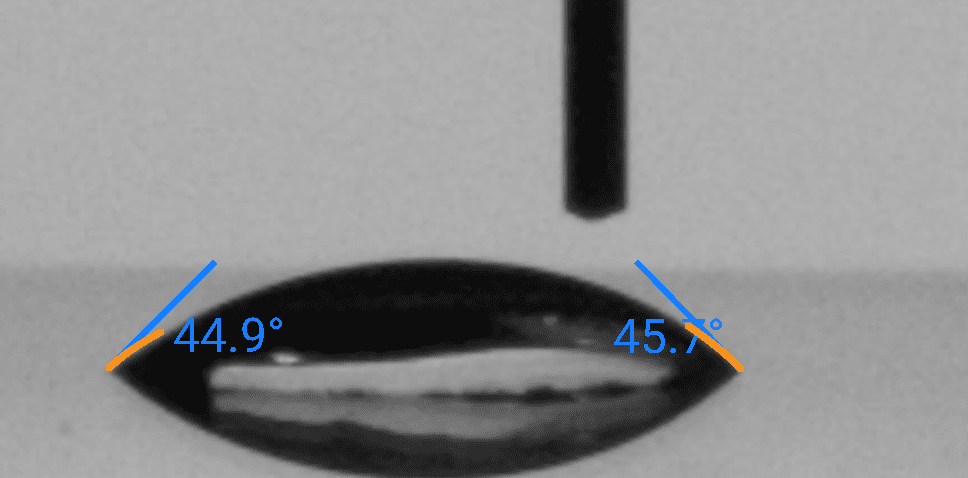
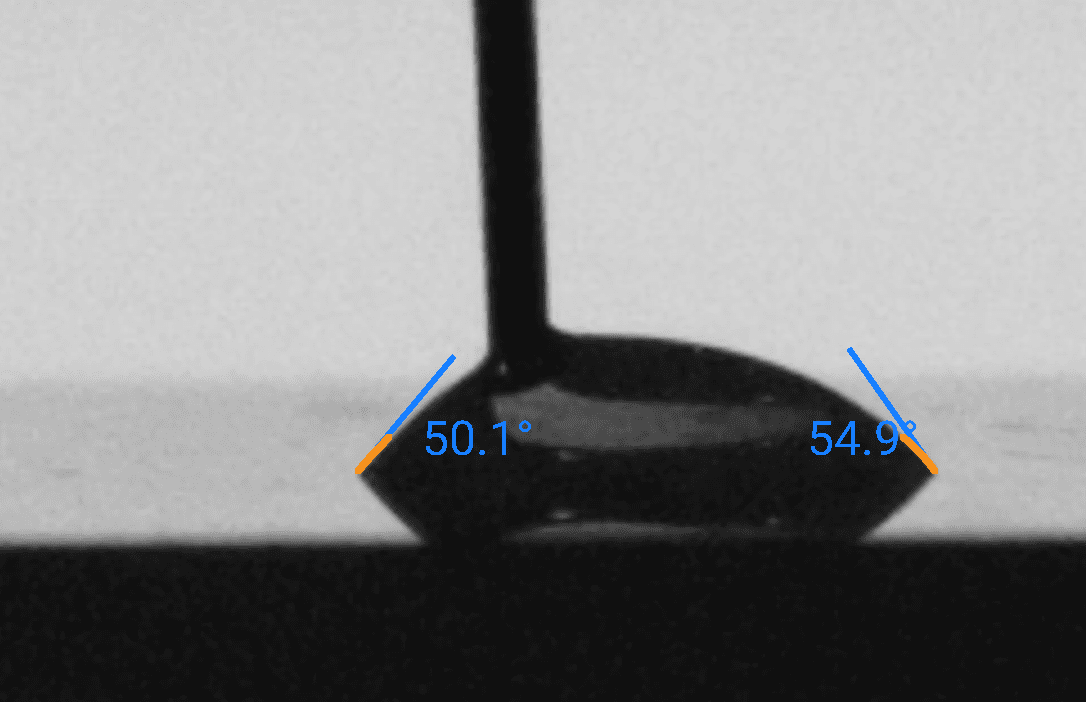
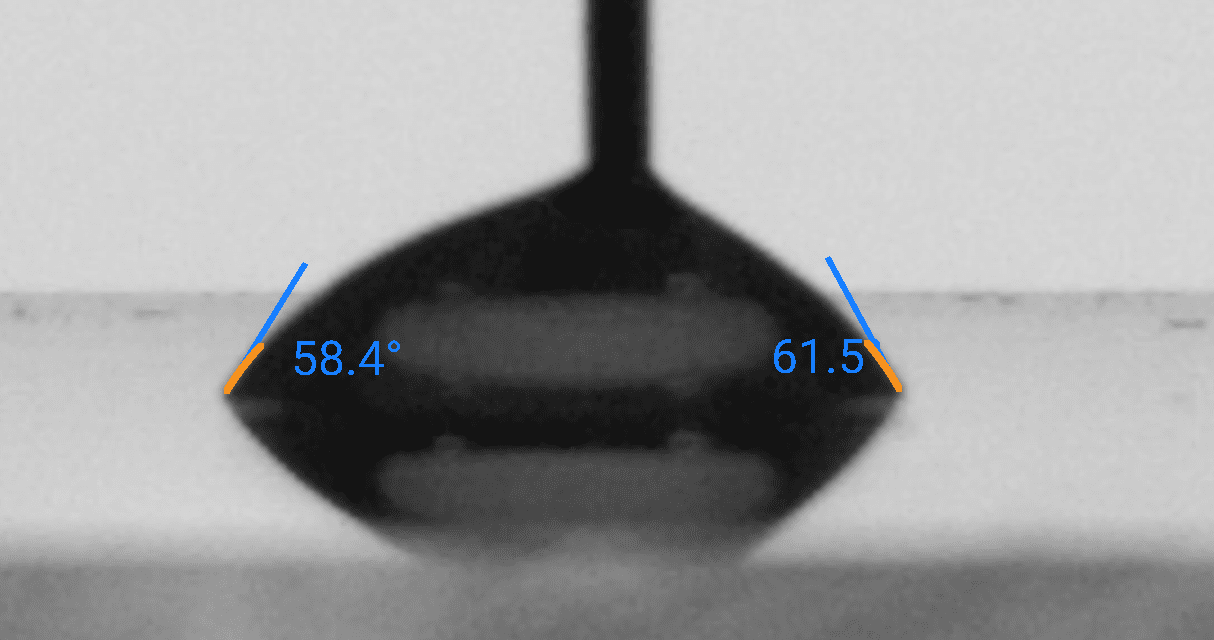
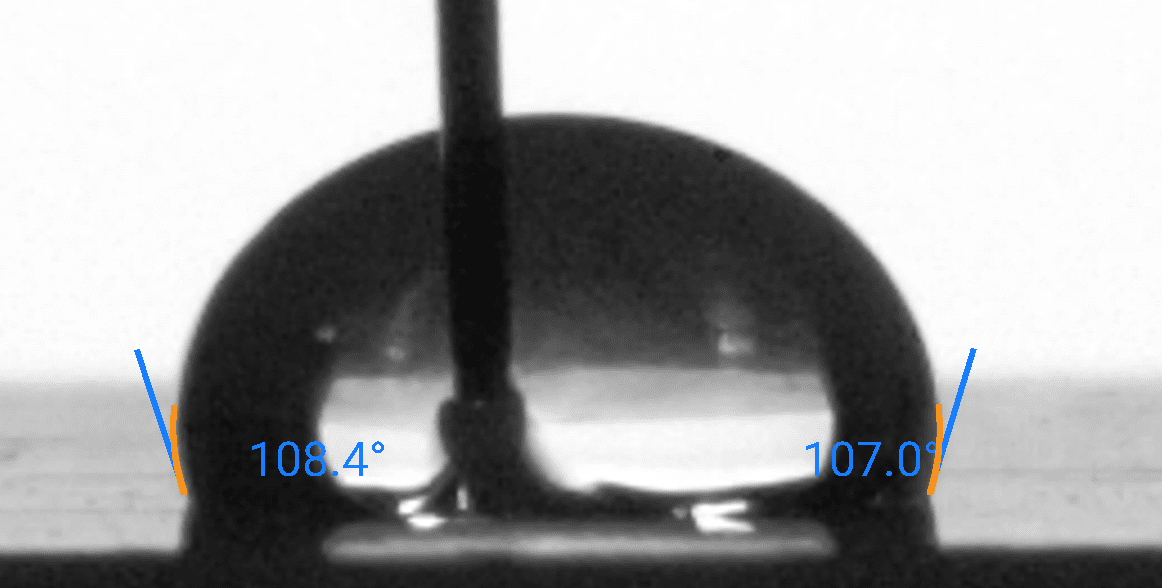
These reference measurements show how deionized water wets four standard substrates measured with the Droplet Lab Dropometer. Use them as visual and numerical benchmarks when you're checking your own sample preparation, treatments, and chemistry.

Full contact angle and surface energy datasets (including additional liquids and statistics) are available on our dataset hub.

Glass - DI Water
Glass - DI Water
Nylon - DI Water
Nylon - DI Water
PMMA - DI Water
PMMA - DI Water
Teflon - DI Water
Teflon - DI Water

The droplet images above are taken from the same benchmark series as our open dataset. For each substrate and probe liquid we report:

● Advancing and receding contact angles (and hysteresis)
● Derived surface energy (SFE) values based on multi-liquid measurements
● Measurement conditions, uncertainties, and sample preparation details

Comparing your own droplet shapes and angles against these references is a fast way to spot contamination, treatment drift, or unexpected changes in wettability.

Capítulo 3: Medición de la tensión superficial

Esta propiedad mide la fuerza que actúa sobre la superficie de un líquido, con el objetivo de minimizar su superficie.

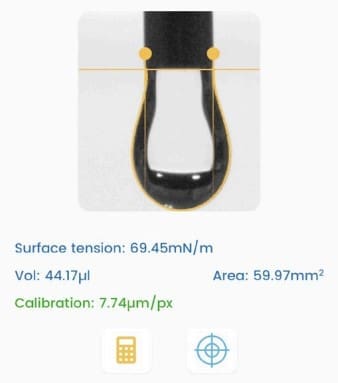
Medición de tensión superficial

Sample Image taken from Droplet Lab Tensiometer

Tensión superficial dinámica

La tensión superficial dinámica difiere de la tensión superficial estática, que se refiere a la energía superficial por unidad de área (o fuerza que actúa por unidad de longitud a lo largo del borde de una superficie líquida).

La tensión superficial estática caracteriza el estado de equilibrio de la interfaz líquida, mientras que la tensión superficial dinámica explica la cinética de los cambios en la interfaz. Estos cambios podrían implicar la presencia de tensioactivos, aditivos o variaciones en la temperatura, la presión y la composición en la interfaz.

Cuándo utilizar la medición dinámica de la tensión superficial

Dynamic surface tension is essential for processes that involve rapid changes at the liquid-gas or liquid-liquid interface, such as droplet and bubble formation, coalescence (change in surface area), the behavior of foams, and the drying of paints (change in composition, e.g., evaporation of solvent). It is measured by analyzing the shape of a hanging droplet over time.

La tensión superficial dinámica se aplica a diversas industrias, incluidas las cosméticas, los recubrimientos, los productos farmacéuticos, la pintura, los alimentos y las bebidas, y los procesos industriales, donde la comprensión y el control del comportamiento de las interfaces líquidas son esenciales para la calidad del producto y la eficiencia del proceso.

Aprenda cómo se realiza la medición de la tensión superficial en nuestro tensiómetro

Para una comprensión más completa de la medición de la energía superficial, lea nuestra medición de la tensión superficial: la guía definitiva

Capítulo 4: Medición de la energía superficial

La energía superficial se refiere a la energía requerida para crear una unidad de área de una nueva superficie.
231

Sample Image taken from Droplet Lab Tensiometer

Aprenda cómo se realiza la medición de la energía superficial en nuestro tensiómetro

Para una comprensión más completa de la medición de la energía superficial, lea nuestra medición de la energía superficial: la guía definitiva

For benchmark contact angle and surface energy values on glass, nylon, PMMA, and Teflon, see the Open Benchmark Data panel above or visit our Dataset Hub for full CSV downloads.

Capítulo 5: Medición del ángulo de deslizamiento

El ángulo de deslizamiento mide el ángulo en el que una película líquida se desliza sobre una superficie sólida. Se emplea comúnmente para evaluar la resistencia al deslizamiento de una superficie.

Ángulo de deslizamiento 1

Sample Image taken from Droplet Lab Tensiometer

Aprenda cómo se realiza la medición del ángulo de deslizamiento en nuestro tensiómetro

Para una comprensión más completa de la medición del ángulo de deslizamiento, lea nuestra medición del ángulo de deslizamiento: la guía definitiva

Capítulo 6: Aplicaciones en el mundo real

Within the Paint industry, several case studies exemplify the advantages of conducting surface property measurements.

Surfactant Compatibility Screening for Waterborne Paint Rheology Modifiers: Using Surface Tension to Flag Nanocellulose Thickening Transitions

The authors evaluate how two common ionic surfactant classes—anionic sodium lauryl sulfate (Stepanol) and cationic HTAB—affect a 1 wt% cellulose nanocrystal (NCC) aqueous suspension over 0–500 ppm surfactant. They quantify steady-shear rheology (power-law parameters) and run surface tension and conductivity in parallel to interpret surfactant–NCC interactions. A key outcome is that cationic surfactant additions can trigger a sharp thickening/network formation above ~300 ppm, whereas the anionic surfactant shows comparatively minor rheology impact over the same range.

Role of the Droplet Lab Goniometer

In this work, a Droplet Lab smartphone-based pendant drop tensiometer was used to measure surface tension of:

  • NCC dispersion (1 wt%) and
  • surfactant–NCC mixtures across 0–500 ppm surfactant.
     

Paint-relevance of this measurement:
Surface tension is a formulation-critical lever for wetting, flow/leveling, defect control (craters/fisheyes), pigment dispersion behavior, and foaming tendency in waterborne paints. Here, surface tension trends were used as a practical indicator of surfactant adsorption/migration behavior that coincided with major rheology shifts, exactly the type of compatibility signal paint formulators want early in screening.
Key Findings

  • All systems remained strongly shear-thinning and were described well by a power-law model (important for application methods like brushing/rolling/spraying where shear varies widely).
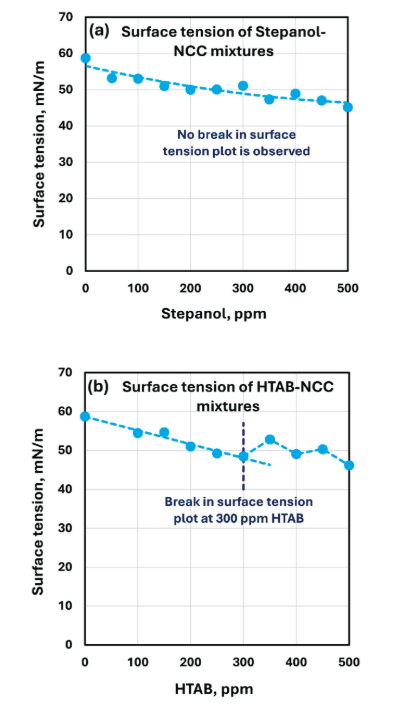
  • Anionic surfactant (Stepanol/SLS) + NCC: rheology impact was weak over 0–500 ppm; consistency index fluctuated without a clear trend, and no breakpoint appeared in conductivity or surface tension curves.
  • Cationic surfactant (HTAB) + NCC: rheology impact was strong above ~300 ppm:consistency index shoots up and the mixture becomes more shear-thinning (flow behavior index drops).
  • Surface tension behavior (Droplet Lab):
    • decreases with surfactant concentration as expected, but
  • HTAB–NCC shows a clear break around ~300 ppm (Figure 15), aligning with the rheology transition region.
    The authors interpret the HTAB transition as charge neutralization and network formation/flocculation of NCC, consistent with conductivity + rheology trends.

Why It Matters

Waterborne paint performance depends on a controlled balance between rheology modifiers (for sag resistance, settling control, spatter control, and application feel) and surfactant/dispersant packages (for wetting and stabilization). This paper provides a cautionary compatibility lesson: introducing certain cationic surfactant chemistries into a negatively charged nanocellulose-thickened system can cause sudden viscosity jumps and stronger shear-thinning, which may translate to poor pumpability, spray issues, leveling defects, or unexpected structure build during storage. Using surface tension measurements alongside rheology offers a fast, formulation-relevant way to screen additive interactions and define safer concentration windows before scale-up.

Method Snapshot

  • Sample: 1 wt% NCC aqueous dispersion; ionic surfactant added 0–500 ppm (Stepanol or HTAB), mixed at ~22 °C.
  • Droplet method: Pendant drop at a stainless-steel needle tip (1.8 mm diameter); imaged by smartphone; Young–Laplace fit used to compute surface tension; 30 repeats per fluid, averaged; room temperature.

Data Note

Figure 15 shows surface tension vs. surfactant concentration for Stepanol–NCC and HTAB–NCC mixtures (Droplet Lab pendant drop tensiometry), including the HTAB breakpoint near ~300 ppm.

Figure

Citation (APA Format)

Pal, A., & Pal, R. (2025). Influence of surfactants on the rheological behavior of nanocrystal suspension (Version 1) [Preprint]. Preprints.org.

View Publication →

The Metal Dilemma: From Peeling to Perfect Adhesion

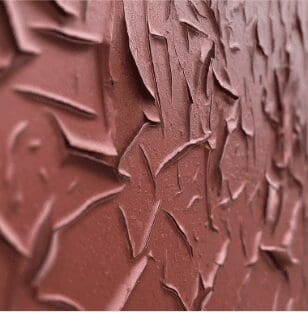
A paint manufacturer dives into coating metal, expecting long-lasting results. But instead, they face a nightmare: paint peeling off after mere months. The culprit? A mismatch in surface energies. Through meticulous surface tension and wettability analysis, the low surface energy of the metal stands exposed. Undeterred, the manufacturer revamps the paint formula, boosting its surface energy. The result? Paint that seamlessly bonds with the metal, forming an inseparable union.

The Metal Dilemma: From Peeling to Perfect Adhesion

Glass Goals: Fogging No More

A paint manufacturer yearns for the perfect glass paint, one that stands strong against the bane of fogging and streaking. Driven by this vision, they embark on a quest to unravel the secrets of surface properties. The shocking truth? The paint's high surface tension was the culprit. With a spark of innovation, they skillfully modify the formula, significantly lowering its surface tension. The result? Pure magic – paint that glides effortlessly on glass, leaving no trace of fog or streaks behind.

Glass Goals: Fogging No More

Concrete Conquests: Crafting Durability

A manufacturer envisioned a paint specifically designed for concrete, one that would withstand the elements and resist wear and tear. Driven by this vision, they embarked on a journey to uncover the secrets of surface properties.

The revelation? The concrete's low surface energy was the hidden enemy. Undeterred, they skillfully incorporated a silane coupling agent into the formula, significantly increasing the paint's surface energy. This ingenious move resulted in paint that not only bonded seamlessly with the concrete but also promised long-lasting durability.

Concrete Conquests: Crafting Durability

Somos sus socios en la resolución de su negocio y tecnología Desafíos

Si está interesado en implementar estas u otras aplicaciones, póngase en contacto con nosotros.

Capítulo 7: Normas y directrices

In an industry where precision reigns supreme, how can Paint manufacturers ensure their products withstand scrutiny? The answer lies in standards and guidelines: the compass that guides them through the complex maze of quality and performance.

ISO 19403-2:2024 — Paints and varnishes — Wettability — Part 2: Determination of the surface free energy of solid surfaces by measuring the contact angle

What it is

Specifies an optical contact-angle method and calculation approach to determine the surface free energy (SFE) of solid surfaces from measured contact angles. Applicable to both substrates and coatings when the protocol (liquids, timing, and analysis model) is controlled and reported consistently.

When to use it

Substrate/coating readiness (incoming QC / pre-coat gate)

Use it to confirm a surface is consistently wetting under a locked method before committing to downstream coating or adhesion testing.

Process/treatment drift & root-cause triage

Use it to detect and localize changes caused by cleaning/pretreatment, formulation shifts, or cure/process drift using trends in contact angle and SFE vs a baseline/reference.

In-scope / Out-of-scope

In scope
  • Solid surfaces including substrates and coatings (e.g., metal, polymer, glass, e-coated/clearcoated panels)
  • Optical contact-angle measurement (typical implementation: sessile-drop goniometry under controlled conditions)
  • Use of probe liquids with known properties suitable for the chosen SFE calculation approach
  • Determination and reporting of SFE (total SFE and, when using a component method, dispersive/polar components per the selected model)
Out of scope
  • Direct adhesion performance certification (e.g., crosshatch, pull-off, durability)—this standard supports prediction/diagnosis, not replacement of adhesion tests
  • Universal pass/fail thresholds (limits must be calibrated to your specific coating/substrate/pretreatment system and outcomes)
  • Direct measurement of liquid surface tension (probe-liquid properties must be known/defined from appropriate sources)
  • Uncontrolled/unstable droplet behavior on very rough, porous, swelling, or strongly absorbing surfaces without additional controls (angles can be time-dependent and edge fits can be unreliable)

Minimum you must report (checklist)

  • ISO edition used (19403-2:2017 or 19403-2:2024) and any deviations from your internal SOP / the referenced edition
  • Surface description (substrate/coating type, finish, lot, pretreatment/cleaning steps, cure status, and time since treatment/coating if relevant)
  • Measurement geometry & instrument method (optical contact angle method; sessile drop if used; analysis software/version)
  • Probe liquids used (identity) and the liquid property set used for the model (e.g., total surface tension and component values if applicable)
  • Droplet volume and dispense method (and any needle/dispense settings that affect droplet formation)
  • Timestamp for angle evaluation after deposition (and any additional timepoints if used)
  • Replicates & sampling plan (number of spots, where measured), plus summary statistics (e.g., median θ and variability such as IQR)
  • Analysis/fitting + SFE model details (edge/fit method, fit QC accept/reject rule, SFE model used—e.g., a component model such as OWRK/Wu if that is your ISO-aligned choice—and reported outputs: γS,total and components if calculated)

Surface free energy values are model- and liquid-set-dependent, so treat them as conditional results under a locked protocol rather than absolute constants. Align your documentation to the ISO 19403-2 edition your quality system references, and calibrate any QC thresholds to real adhesion/defect outcomes.

How to interpret results (guardrails)

  • Use fixed-time comparisons only: Lower θ at the defined timestamp generally indicates better wetting, but only compare against your own baseline using the same liquid, volume, timing, and model.
  • Separate “shift” vs “non-uniformity”: A systematic change in median θ (or γS trend) suggests process drift; a high IQR/spot spread suggests contamination streaks, non-uniform pretreatment, heterogeneous cure, or coating defects.
  • Treat high variability as a stop-and-triage signal: If fit QC fails or IQR spikes, re-run the spot and investigate upstream causes before making lot-level decisions.
  • Make gates defensible with correlation: Green/Yellow/Red limits are only valid after you correlate θ/IQR/(optional) γS trends to your downstream truth metric (adhesion, defect rate, scrap/rework), and you should re-calibrate when materials or processes change.

Ahora te toca a ti

We hope this guide showed you how to apply surface science in the Paint industry.

Ahora nos gustaría entregárselo a usted: 

Feel free to leave a comment below—we’d love to hear from you.

Contesta

Su dirección de correo electrónico no será publicada. Los campos obligatorios están marcados *