Contenido

Utilidades Industria
The Practical Guide to Surface Science (2026)

?s=100&d=m
Escrito por
No biography added yet.
leer más
?s=100&d=m
Reviewed by
N/A
No biography added yet.
leer más
?s=100&d=m
Written By

No biography added yet.

?s=100&d=m
Reseña escrita por

N/A N/A

No biography added yet.

This is a practical guide to Surface Science for researchers working in the Utilities Industry.

En esta nueva guía aprenderás todo sobre:

  • Principios cruciales de la ciencia de superficies
  • The significance of surface science measurements for the Utilities industry
  • Normas y directrices ASTM aplicables

Vamos a sumergirnos en ello.

Energy, Electricity & Lighting

Executive Summary

What it covers: A practical surface-science guide for utilities that explains how to measure and interpret contact angle (static + advancing/receding), surface tension (incl. dynamic), surface energy, and sliding angle; plus where each measurement matters in real utility operations and maintenance. It also includes benchmark datasets and field-relevant examples (e.g., coatings, corrosion, transformer oil/insulation health, and rapid water-screening devices).
Key insights: Static contact angles can be misleading on real, imperfect surfaces, advancing/receding angles and hysteresis give a more complete picture of wetting, cleanliness, roughness, and coating performance. For measurement methods, Young–Laplace is more consistent but prefers axisymmetric drops, while polynomial fitting is more flexible but more sensitive to local defects; dynamic surface tension is the right tool when interfaces evolve quickly (bubbles/droplets, foams, drying, surfactants).
Business value: Using these measurements helps utilities choose and validate coatings that repel water, resist corrosion, reduce leakage/film formation, and improve safety; extending asset life and lowering maintenance cost (especially in harsh environments like offshore infrastructure). Surface-property data also strengthens root-cause analysis and trending for issues like RTV silicone degradation from oil exposure and transformer oil aging indicators tied to interfacial/surface tension behavior.
Standards to follow: Follow IEC TS 62073 (especially Method A: contact angle) for hydrophobicity assessment of insulator surfaces, including multi-zone sampling, reporting θr (primary) plus θa/θs as applicable, and documenting water quality and environmental conditions. Where your QA system requires it, align supporting procedures with relevant ASTM/ISO methods for wettability, surface tension, surface energy, and sliding/roll-off testing; while keeping reporting consistent with the IEC framework for insulator hydrophobicity work.
Bottom line: This guide is a practical, utility-focused playbook for what to measure, how to measure it, and how to use results to make defensible decisions about coatings, reliability, and maintenance. The emphasis is on repeatable, audit-ready measurement practice (benchmarks + zone-based trending) so surface-property data turns into operational action instead of one-off lab numbers.

Capítulo 1: Introducción

Energy companies, gas utilities, and transformer maintenance form the utility sector, a cornerstone of modern infrastructure crucial for our daily lives. Global demand fluctuations directly impact this sector. To meet projected demand growth, ongoing efforts are focused on upgrading electricity transmission and distribution system policies. In the utility sector, any new development must consider the critical role of surface properties. Characteristics like contact angle, sliding angle, surface tension, and surface energy play a pivotal role in ensuring the efficiency, safety, and reliability of various operations. This guide aims to shed light on the importance of these surface properties in the utility sector and showcase the potential benefits of utilizing their measurements. 

We use the following surface properties to understand the behavior of Utilities products and improve their quality.

Capítulo 2: Medición del ángulo de contacto

El ángulo de contacto cuantifica la humectabilidad de una superficie representando el ángulo entre la superficie de un líquido y una superficie sólida.
Investigación de Dropletlab

Sample Image taken from Droplet Lab Tensiometer.

Joven – Método Laplace

Método polinómico

Ángulo de contacto dinámico

Ideally, when we place a drop on a solid surface, a unique angle exists between the liquid and the solid surface. We can calculate the value of this ideal contact angle (the so-called Young’s contact angle) using Young’s equation. In practice, due to surface geometry, roughness, heterogeneity, contamination, and deformation, the contact angle value on a surface is not necessarily a single consistent value but rather falls within a range. The upper and lower limits of this range are known as the advancing and receding contact angles, respectively. The values of advancing and receding contact angles for a solid surface are highly sensitive to many parameters, such as temperature, humidity, homogeneity, and minor contamination of the surface and liquid. For example, the advancing and receding contact angles of a surface can differ at different locations.

Ángulo de contacto dinámico frente a ángulo de contacto estático

Las superficies y los recubrimientos prácticos muestran naturalmente histéresis de ángulo de contacto, lo que indica un rango de valores de equilibrio. Cuando medimos ángulos de contacto estáticos, obtenemos un solo valor dentro de este rango. Confiar únicamente en mediciones estáticas plantea problemas, como una repetibilidad deficiente y una evaluación incompleta de la superficie con respecto a la adherencia, la limpieza, la rugosidad y la homogeneidad.

In practical applications, we need to understand how easily a liquid spreads (advancing angle) and how easily it is removed (receding angle), such as in painting and cleaning. Measuring advancing and receding angles offers a holistic view of liquid-solid interaction, unlike static measurements, which yield an arbitrary value within the range.

Esta información es crucial para las superficies del mundo real con variaciones, rugosidad y dinámica, lo que ayuda a industrias como la cosmética, la ciencia de los materiales y la biotecnología a diseñar superficies efectivas y optimizar los procesos.

Aprenda cómo se realiza la medición del ángulo de contacto en nuestro tensiómetro

Para una comprensión más completa de la medición del ángulo de contacto, lea nuestra medición del ángulo de contacto: la guía definitiva

Open Benchmark Data: Contact Angle & Surface Energy

These reference measurements show how deionized water wets four standard substrates measured with the Droplet Lab Dropometer. Use them as visual and numerical benchmarks when you're checking your own sample preparation, treatments, and chemistry.

Full contact angle and surface energy datasets (including additional liquids and statistics) are available on our dataset hub.

Glass - DI Water
Glass - DI Water
Nylon - DI Water
Nylon - DI Water
PMMA - DI Water
PMMA - DI Water
Teflon - DI Water
Teflon - DI Water

The droplet images above are taken from the same benchmark series as our open dataset. For each substrate and probe liquid we report:

● Advancing and receding contact angles (and hysteresis)
● Derived surface energy (SFE) values based on multi-liquid measurements
● Measurement conditions, uncertainties, and sample preparation details

Comparing your own droplet shapes and angles against these references is a fast way to spot contamination, treatment drift, or unexpected changes in wettability.

Capítulo 3: Medición de la tensión superficial

Esta propiedad mide la fuerza que actúa sobre la superficie de un líquido, con el objetivo de minimizar su superficie.

Medición de tensión superficial

Sample Image taken from Droplet Lab Tensiometer

Tensión superficial dinámica

La tensión superficial dinámica difiere de la tensión superficial estática, que se refiere a la energía superficial por unidad de área (o fuerza que actúa por unidad de longitud a lo largo del borde de una superficie líquida).

La tensión superficial estática caracteriza el estado de equilibrio de la interfaz líquida, mientras que la tensión superficial dinámica explica la cinética de los cambios en la interfaz. Estos cambios podrían implicar la presencia de tensioactivos, aditivos o variaciones en la temperatura, la presión y la composición en la interfaz.

Cuándo utilizar la medición dinámica de la tensión superficial

Dynamic surface tension is essential for processes that involve rapid changes at the liquid-gas or liquid-liquid interface, such as droplet and bubble formation, coalescence (change in surface area), the behavior of foams, and the drying of paints (change in composition, e.g., evaporation of solvent). It is measured by analyzing the shape of a hanging droplet over time.

La tensión superficial dinámica se aplica a diversas industrias, incluidas las cosméticas, los recubrimientos, los productos farmacéuticos, la pintura, los alimentos y las bebidas, y los procesos industriales, donde la comprensión y el control del comportamiento de las interfaces líquidas son esenciales para la calidad del producto y la eficiencia del proceso.

Aprenda cómo se realiza la medición de la tensión superficial en nuestro tensiómetro

Para una comprensión más completa de la medición de la energía superficial, lea nuestra medición de la tensión superficial: la guía definitiva

Capítulo 4: Medición de la energía superficial

La energía superficial se refiere a la energía requerida para crear una unidad de área de una nueva superficie.
231

Sample Image taken from Droplet Lab Tensiometer

Aprenda cómo se realiza la medición de la energía superficial en nuestro tensiómetro

Para una comprensión más completa de la medición de la energía superficial, lea nuestra medición de la energía superficial: la guía definitiva

For benchmark contact angle and surface energy values on glass, nylon, PMMA, and Teflon, see the Open Benchmark Data panel above or visit our Dataset Hub for full CSV downloads.

Capítulo 5: Medición del ángulo de deslizamiento

El ángulo de deslizamiento mide el ángulo en el que una película líquida se desliza sobre una superficie sólida. Se emplea comúnmente para evaluar la resistencia al deslizamiento de una superficie.

Ángulo de deslizamiento 1

Sample Image taken from Droplet Lab Tensiometer

Aprenda cómo se realiza la medición del ángulo de deslizamiento en nuestro tensiómetro

Para una comprensión más completa de la medición del ángulo de deslizamiento, lea nuestra medición del ángulo de deslizamiento: la guía definitiva

Capítulo 6: Aplicaciones en el mundo real

Within the Utilities industry, several case studies exemplify the advantages of conducting surface property measurements.

Rapid, On‑Site Water Hardness Screening for Utility Distribution & Treatment Using a Dip‑and‑Read Paper Device (Validated by Contact-Angle‑Optimized Hydrophobic Barriers)

This paper reports a dip‑and‑read microfluidic paper-based analytical device (µPAD) for qualitative and quantitative measurement of total water hardness. The authors fabricate hydrophobic barriers on filter paper using common office tools—a standard printer plus a commercially available permanent marker—aiming to enable low-cost fabrication in labs without specialized equipment. They first assess marker inks for wettability and barrier performance, selecting the most hydrophobic colors for reliable liquid confinement. The final device includes five reaction/detection zones aligned with WHO hardness classes, providing a naked-eye, color-change readout (blue → pink) in about 3 minutes to classify water as soft, moderately hard, hard, or very hard. For quantitative use, they implement an alternative colorimetric approach that enables numeric hardness estimation without requiring EDTA in the quantification channel, while maintaining low complexity and cost. The reported limit of detection is 0.02 mM, substantially lower than typical commercial test strips and several reported µPAD methods, and real-world tap-water results agree with standard EDTA titration. The device remains stable for ~2 months under room and refrigerated storage and withstands short exposure across 25–100 °C, supporting field use without sophisticated handling.

Role of the Droplet Lab Goniometer

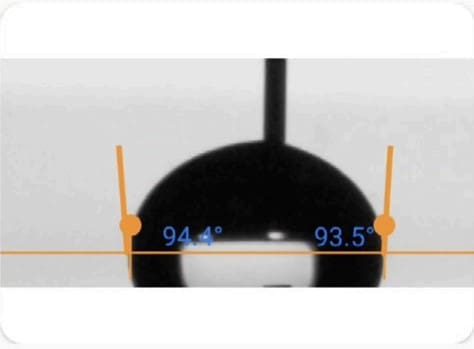
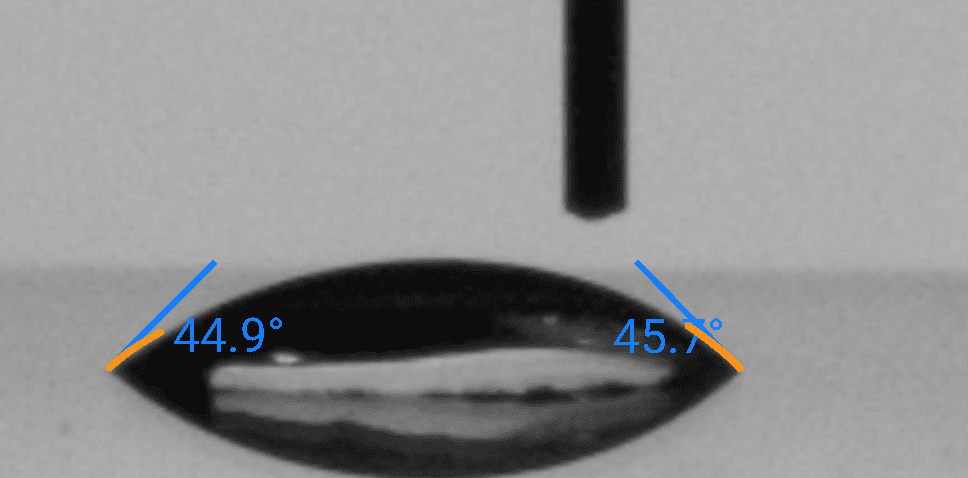
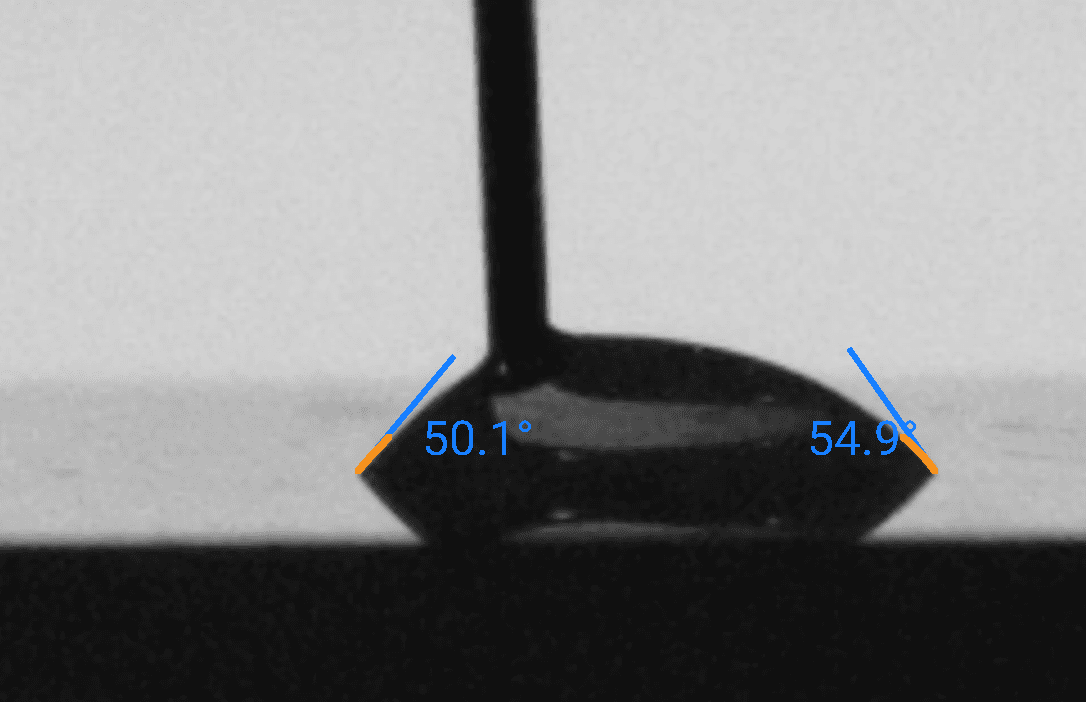
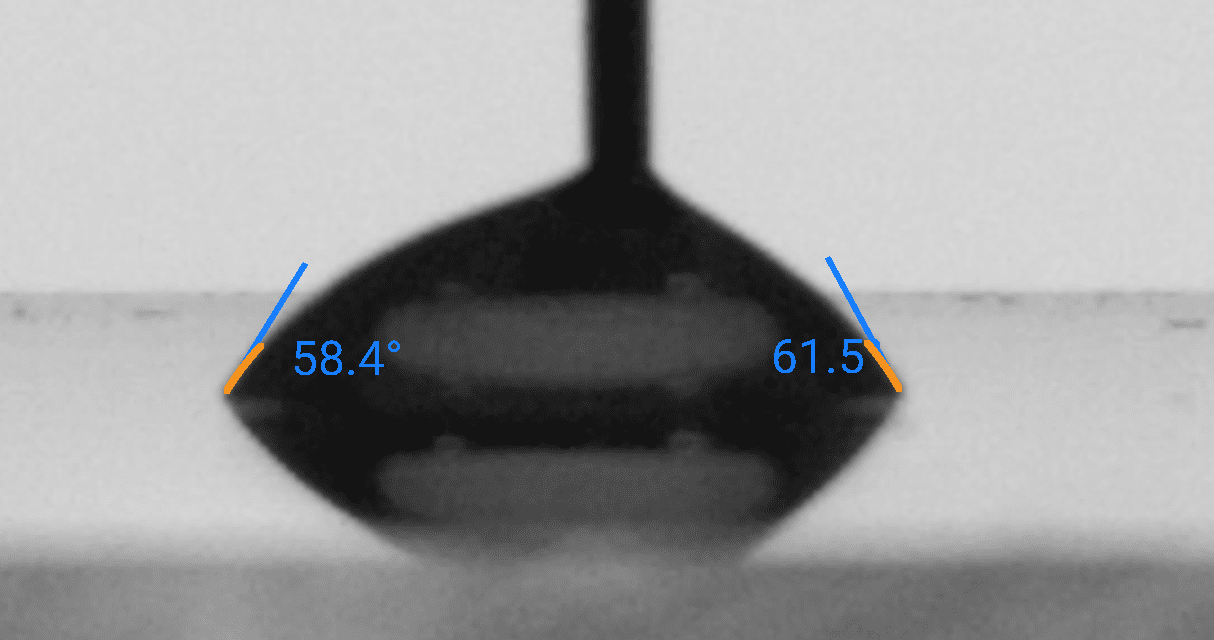
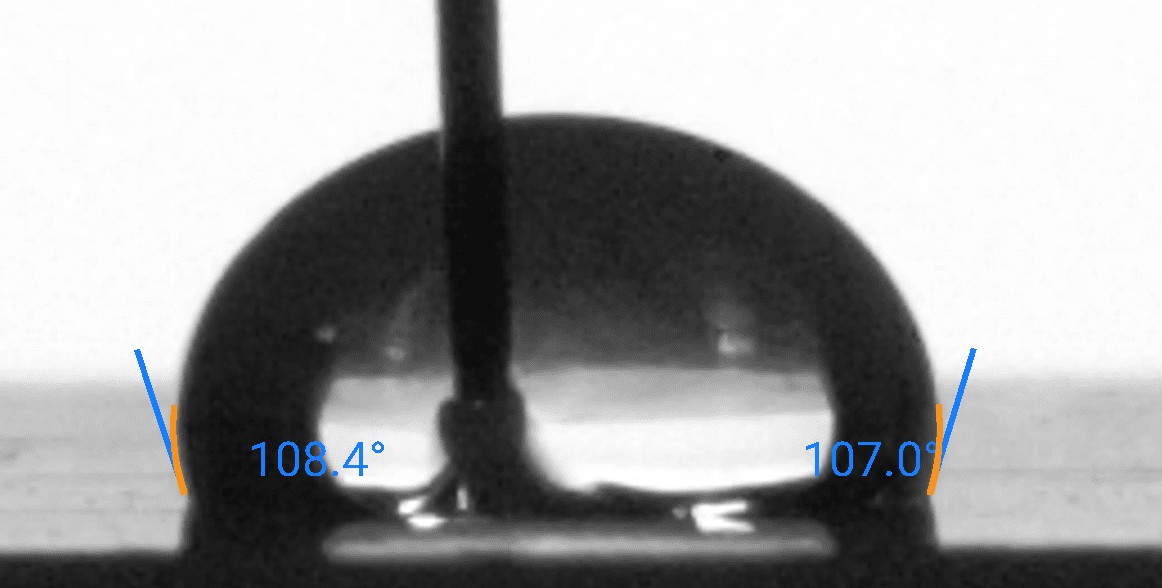
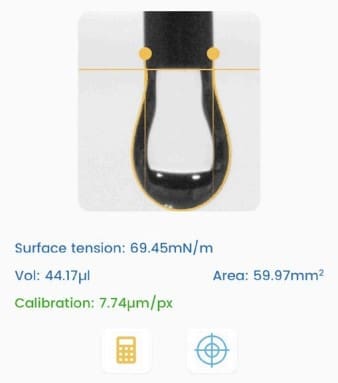
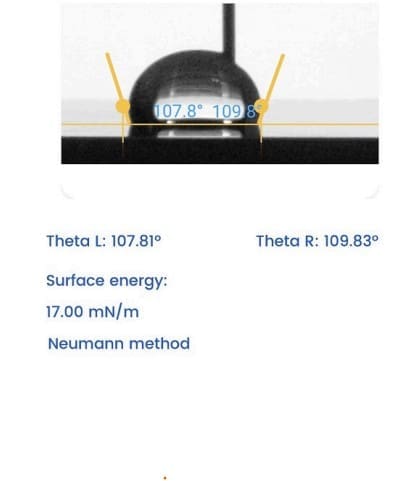
The Droplet Lab instrument (reported as a Dropometer by Droplet Smart Tech, with analysis via a sessile-drop app) was used to quantify water contact angles on permanent-marker–treated paper to select ink colors that form robust hydrophobic barriers.

  • In Methods 2.6 (page 6), the authors describe applying marker inks (blue, green, red, black) to Whatman Grade 4 filter paper, placing an HPLC-water droplet, capturing an image, and analyzing it with a sessile-drop application.

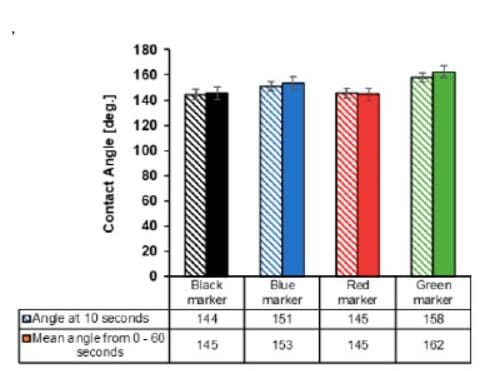
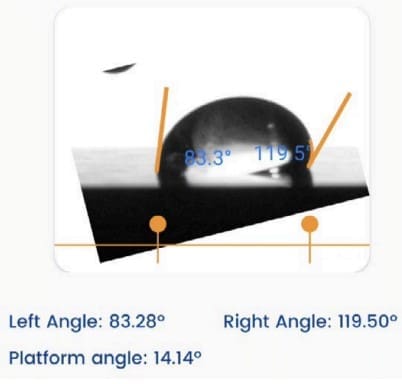
In Results 3.1 and Figure 3b (pages 7–8), they report high contact angles (e.g., ~151° for blue and ~158° for green at 10 s), supporting the decision to fabricate µPAD barriers with blue/green markers for better confinement and reduced leakage.
Why this matters: The goniometer data directly underpins barrier material selection—a critical factor for utility-field devices where leakage or poor channel definition can invalidate a hardness test.

Key Findings

  • Marker-ink hydrophobicity was quantified via contact angle, enabling rational selection of barrier inks (green/blue most hydrophobic; Results §3.1; Figure 3b).
  • Leakage testing confirmed that green/blue barriers resisted leakage under dyed-water challenge, while red/black leaked (Figure 4, page 9).
  • The µPAD provides WHO-aligned qualitative hardness classification (soft → very hard) by blue-to-pink zone changes in ~3 min (device concept Figures 1 & 5; qualitative results Figure 6a).
  • A quantitative route uses the control detection zone and color intensity analysis (scanner/phone + ImageJ) to build a calibration curve (Figure 6b).
  • LOD = 0.02 mM, outperforming typical commercial strips and several prior µPAD reports (Results 3.2.3; comparison Figure 7).
  • Real tap-water samples from multiple locations showed close agreement with standard EDTA titration (Figure 8).
  • The device demonstrates shelf stability (weeks at room temp and 4 °C) and temperature robustness (short exposures up to 100 °C) (Figure 9).

Common ions showed minimal interference under tested conditions (Figure 10).

Why it Matters

For utilities, hardness is a practical driver of scaling risk, customer complaints, and treatment decisions (e.g., softening dose, corrosion/incrustation balance). This work demonstrates a field-ready approach that can screen and classify hardness in minutes without pipettes or bulky instrumentation, while also offering a quantitative option when numeric tracking is required (e.g., verifying treatment performance, monitoring district variability). The contact-angle‑guided selection of barrier inks improves device reliability—supporting repeatable point-of-use testing that can inform operational adjustments and maintenance prioritization across distribution networks.

Method Snapshot

  • Substrate/sample: Whatman Grade 4 filter paper squares coated with different permanent-marker inks (blue/green/red/black).

Droplet & conditions: HPLC-grade water sessile droplet at room conditions; static/sessile contact angle recorded (reported at ~10 s and tracked up to 60 s). Surface tension was not measured in this study (water used as the probe liquid).

Data Note

The contact angle measurement over time for the black marker, blue marker, red marker, and green marker on Whatman® Grade 4 filter paper on exposure to drops of HPLC grade water (slanted shade is measurement at 10 s and full color shade is mean measurement over 60 s). Each bar represents the mean of the three individual experiments standard deviation.

Figure

Citation (APA Format)

Oyewunmi, O. D., Safiabadi-Tali, S. H., & Jahanshahi-Anbuhi, S. (2020). Dual-modal assay kit for the qualitative and quantitative determination of the total water hardness using a permanent marker fabricated microfluidic paper-based analytical device. Chemosensors, 8(4), 97. https://doi.org/10.3390/chemosensors8040097

View Publication →

Equipment Durability and Corrosion Resistance

Offshore equipment faces a harsh reality: constant exposure to saltwater leads to corrosion and decreased lifespan. The Company's maintenance team combats this challenge by applying hydrophobic coatings with high contact angles directly onto equipment surfaces like pipelines, valves, and metal structures. These coatings actively repel water, preventing the formation of corrosive layers. This proactive approach extends the critical infrastructure's lifespan, ultimately reducing maintenance costs and boosting the overall efficiency of offshore operations.

Equipment Durability and Corrosion Resistance

Safety and Fire Resistance

Natural gas processing facilities face the challenge of preventing fire-related accidents through stringent safety measures. The solution lies in recognizing the crucial role surface properties of coated equipment play in fire prevention and damage minimization. Plants can introduce flame-retardant coatings with low surface energy on various structural components and equipment surfaces. These coatings effectively reduce surface tension, making it difficult for flammable materials to adhere to surfaces.

Safety and Fire Resistance

Deterioration in the Performance of RTV Silicone Rubber due to Oil Leakage

Oil leakage from transformers can severely degrade the performance of room temperature vulcanized (RTV) silicone rubber coatings. To investigate this, we can utilize contact angle measurements to assess the impact of transformer oil on RTV silicone rubber performance. Previous studies indicate that contact angle initially increases with short immersion times but then fluctuates as immersion duration lengthens. Despite these fluctuations, all samples maintain good hydrophobicity. In this study, we immersed RTV silicone rubber in transformer oil for varying periods. This demonstrates the potential of contact angle measurements to effectively investigate the degradation of RTV silicone rubber caused by transformer oil.

Deterioration in the Performance of RTV Silicone Rubber due to Oil Leakage

Transformers insulation failure from aging

Aging transformers face the challenge of insulation failure, which can have severe consequences for both safety and economic impact if not identified and addressed quickly. Scheduled maintenance practices employ various laboratory techniques as solutions for aging detection. These methods include breakdown voltage (BDV), spectroscopy, dissolved gas analysis, total acid number, and interfacial tension. A previous study suggests that interfacial tension (IFT) and total acid number (TAN) are more accurate reflections of transformer oil aging compared to other techniques, which can be influenced by unrelated parameters. Since assessing interfacial tension involves evaluating the oil's surface tension, evaluating surface properties becomes crucial in studying aging-related insulation failure in transformers.

Transformers insulation failure from aging

Corrosion in Multiphase Flow during Oil Production

Challenge: Oil production faces a significant hurdle in managing corrosion during multiphase flow.

Solution: This multiphase flow refers specifically to oil-water-gas mixtures flowing through steel pipes. Previous research suggests that pre-adsorption of inhibitor molecules onto the steel surface can potentially alter its wettability, shifting it from water-loving (hydrophilic) to oil-loving (hydrophobic). This change in surface behavior could ultimately lead to reduced corrosion by promoting oil wetting. Measuring contact angle and surface tension plays a crucial role in understanding and quantifying this conversion from hydrophilic to hydrophobic states.

Corrosion in Multiphase Flow during Oil Production

Somos sus socios en la resolución de su negocio y tecnología Desafíos

Si está interesado en implementar estas u otras aplicaciones, póngase en contacto con nosotros.

Capítulo 7: Normas y directrices

In an industry where precision reigns supreme, how can Utilities manufacturers ensure their products withstand scrutiny? The answer lies in standards and guidelines: the compass that guides them through the complex maze of quality and performance.

IEC TS 62073 — Guidance on the Measurement of Hydrophobicity of Insulator Surfaces (Method A focus: Contact Angle)

What it is

IEC TS 62073 is a technical specification that gives guidance for measuring the hydrophobicity of insulator surfaces using three approaches (A: contact angle, B: surface-tension method, C: spray method). Method A evaluates hydrophobicity via sessile-drop (and, where needed, captive-bubble) contact angles—typically reporting static (θs) and, when performed, advancing (θa) and receding (θr).

When to use it

Acceptance / QA of insulators and coatings

Use Method A when you need numeric, comparable evidence of “how hydrophobic is this surface right now?” on defined zones, with traceable documentation.

Ageing, pollution, and recovery programs (lab or field trending)

Use Method A when you need repeatable zone-by-zone time series to detect hydrophobicity loss, recovery, or increasing non-uniformity.

In-scope / Out-of-scope

In scope
  • Composite (polymeric) housings/sheds and ceramic insulators (coated or uncoated)
  • Hydrophobicity as a time-stamped observation (the measured value reflects the surface state at the time of measurement)
  • Multi-area / multi-zone sampling expectations (hydrophobicity is spatially variable around an insulator)
  • Method A angle guidance including θs and (when measured) θa and θr, with θr emphasized as most representative of hydrophobic behavior
Out of scope
  • Hydrophobicity Class (HC/1…HC/7) reporting as a numeric angle (HC classes belong to Method C spray results and should not be mixed with θ values)
  • Universal pass/fail thresholds for maintenance decisions (action bands must be calibrated to your fleet, environment, and risk criteria)
  • Guaranteeing high-precision “ideal surface” metrology on installed/service-aged parts (real geometries/pollution layers limit precision)
  • Direct flashover-risk prediction from a single contact angle without correlation to operational indicators (e.g., leakage current, site severity)

Minimum you must report (checklist)

  • Test object identification: insulator ID, material type (polymeric/ceramic), coating status, and surface condition (as-found / cleaned / aged / polluted).
  • Method declaration: IEC TS 62073 Method A (contact angle) and whether sessile-drop and/or captive-bubble was used.
  • Zone map / location definition: where each measurement was taken (e.g., trunk vs shed edge vs rib tip; windward vs leeward), with counts per zone.
  • Water quality: de-ionized water (and any handling/storage notes that could affect surface tension).
  • Environmental metadata: temperature and relative humidity (and, if relevant, exposure step/time since exposure).
  • Angles and replicates: θr (primary), plus θa and θs when measured; number of droplets per zone; summary stats per zone (at least median + spread such as IQR).
  • Evidence artifacts: per-drop image(s) or overlays showing the fitted baseline/edge and angle values (audit-ready traceability).
  • Data-quality and deviations: rejection criteria used (e.g., glare/edge distortion, unstable baseline fit, droplet sliding/roll-off) and any deviations from your SOP (including geometry-driven switch to captive-bubble).

IEC TS 62073 treats hydrophobicity as time- and location-dependent, so defensible practice requires repeatable conditions and multi-area sampling rather than one-off single-spot readings. Tools like Dropometer can standardize droplet placement, image capture, analysis, zone tagging, and reporting, but they do not replace the official IEC document.

How to interpret results (guardrails)

  • Prioritize θr for decisions: higher θr generally means the surface more readily de-wets (less persistent water film) at the time of test; lower θr suggests greater wetting tendency.
  • Use trends + zone maps, not single numbers: increasing zone-to-zone spread is often the operational signal (UV-facing vs sheltered; edge vs trunk), not “noise.”
  • Treat hysteresis (Δθ = θa − θr) as a diagnostic: large hysteresis often indicates pinning/heterogeneity/contamination and can increase scatter—don’t over-interpret it as a single-cause proof.
  • Calibrate action bands internally: define Green/Yellow/Red (or equivalent) from your own correlation data (e.g., leakage current, inspections, site severity), because the TS provides the measurement framework, not universal cutoffs.

Ahora te toca a ti

We hope this guide showed you how to apply surface science in the Utilities industry.

Ahora nos gustaría entregárselo a usted:

Feel free to leave a comment below—we’d love to hear from you.

Contesta

Su dirección de correo electrónico no será publicada. Los campos obligatorios están marcados *