Contenido

Dispositivo médico Industria
The Practical Guide to Surface Science (2026)

?s=100&d=m
Escrito por
No biography added yet.
leer más
?s=100&d=m
Reviewed by
N/A
No biography added yet.
leer más
?s=100&d=m
Written By

No biography added yet.

?s=100&d=m
Reseña escrita por

N/A N/A

No biography added yet.

This is a practical guide to Surface Science for researchers working in the Medical Device Industry.

En esta nueva guía aprenderás todo sobre:

  • Principios cruciales de la ciencia de superficies
  • The significance of surface science measurements for the Medical Device industry
  • Normas y directrices ASTM aplicables

Vamos a sumergirnos en ello.

Dispositivo médico

Capítulo 1: Introducción

The efficient and reliable functioning of medical devices greatly depends on selecting the right materials and understanding their interactions within the device and with the surroundings. For example, materials should have good strength, durability, and minimal issues with corrosion resistance. Different surface properties, such as contact angle, sliding angle, surface energy, and surface tension, play a key role in performance and safety. These properties influence the biocompatibility, adhesion, wear resistance, and antifouling characteristics of medical devices.


Dispositivo médico

We use the following surface properties to understand the behavior of Medical Device products and improve their quality.

Capítulo 2: Medición del ángulo de contacto

El ángulo de contacto cuantifica la humectabilidad de una superficie representando el ángulo entre la superficie de un líquido y una superficie sólida.
Investigación de Dropletlab

Sample Image taken from Droplet Lab Tensiometer.

Joven – Método Laplace

Método polinómico

Ángulo de contacto dinámico

Ideally, when we place a drop on a solid surface, a unique angle exists between the liquid and the solid surface. We can calculate the value of this ideal contact angle (the so-called Young’s contact angle) using Young’s equation. In practice, due to surface geometry, roughness, heterogeneity, contamination, and deformation, the contact angle value on a surface is not necessarily a single consistent value but rather falls within a range. The upper and lower limits of this range are known as the advancing and receding contact angles, respectively. The values of advancing and receding contact angles for a solid surface are highly sensitive to many parameters, such as temperature, humidity, homogeneity, and minor contamination of the surface and liquid. For example, the advancing and receding contact angles of a surface can differ at different locations.

Ángulo de contacto dinámico frente a ángulo de contacto estático

Las superficies y los recubrimientos prácticos muestran naturalmente histéresis de ángulo de contacto, lo que indica un rango de valores de equilibrio. Cuando medimos ángulos de contacto estáticos, obtenemos un solo valor dentro de este rango. Confiar únicamente en mediciones estáticas plantea problemas, como una repetibilidad deficiente y una evaluación incompleta de la superficie con respecto a la adherencia, la limpieza, la rugosidad y la homogeneidad.

In practical applications, we need to understand how easily a liquid spreads (advancing angle) and how easily it is removed (receding angle), such as in painting and cleaning. Measuring advancing and receding angles offers a holistic view of liquid-solid interaction, unlike static measurements, which yield an arbitrary value within the range.

Esta información es crucial para las superficies del mundo real con variaciones, rugosidad y dinámica, lo que ayuda a industrias como la cosmética, la ciencia de los materiales y la biotecnología a diseñar superficies efectivas y optimizar los procesos.

Aprenda cómo se realiza la medición del ángulo de contacto en nuestro tensiómetro

Para una comprensión más completa de la medición del ángulo de contacto, lea nuestra medición del ángulo de contacto: la guía definitiva

Open Benchmark Data: Contact Angle & Surface Energy

These reference measurements show how deionized water wets four standard substrates measured with the Droplet Lab Dropometer. Use them as visual and numerical benchmarks when you're checking your own sample preparation, treatments, and chemistry.

Full contact angle and surface energy datasets (including additional liquids and statistics) are available on our dataset hub.

Glass - DI Water
Glass - DI Water
Nylon - DI Water
Nylon - DI Water
PMMA - DI Water
PMMA - DI Water
Teflon - DI Water
Teflon - DI Water

The droplet images above are taken from the same benchmark series as our open dataset. For each substrate and probe liquid we report:

● Advancing and receding contact angles (and hysteresis)
● Derived surface energy (SFE) values based on multi-liquid measurements
● Measurement conditions, uncertainties, and sample preparation details

Comparing your own droplet shapes and angles against these references is a fast way to spot contamination, treatment drift, or unexpected changes in wettability.

Capítulo 3: Medición de la tensión superficial

Esta propiedad mide la fuerza que actúa sobre la superficie de un líquido, con el objetivo de minimizar su superficie.

Medición de tensión superficial

Sample Image taken from Droplet Lab Tensiometer

Tensión superficial dinámica

La tensión superficial dinámica difiere de la tensión superficial estática, que se refiere a la energía superficial por unidad de área (o fuerza que actúa por unidad de longitud a lo largo del borde de una superficie líquida).

La tensión superficial estática caracteriza el estado de equilibrio de la interfaz líquida, mientras que la tensión superficial dinámica explica la cinética de los cambios en la interfaz. Estos cambios podrían implicar la presencia de tensioactivos, aditivos o variaciones en la temperatura, la presión y la composición en la interfaz.

Cuándo utilizar la medición dinámica de la tensión superficial

Dynamic surface tension is essential for processes that involve rapid changes at the liquid-gas or liquid-liquid interface, such as droplet and bubble formation, coalescence (change in surface area), the behavior of foams, and the drying of paints (change in composition, e.g., evaporation of solvent). It is measured by analyzing the shape of a hanging droplet over time.

La tensión superficial dinámica se aplica a diversas industrias, incluidas las cosméticas, los recubrimientos, los productos farmacéuticos, la pintura, los alimentos y las bebidas, y los procesos industriales, donde la comprensión y el control del comportamiento de las interfaces líquidas son esenciales para la calidad del producto y la eficiencia del proceso.

Aprenda cómo se realiza la medición de la tensión superficial en nuestro tensiómetro

Para una comprensión más completa de la medición de la energía superficial, lea nuestra medición de la tensión superficial: la guía definitiva

Capítulo 4: Medición de la energía superficial

La energía superficial se refiere a la energía requerida para crear una unidad de área de una nueva superficie.
231

Sample Image taken from Droplet Lab Tensiometer

Aprenda cómo se realiza la medición de la energía superficial en nuestro tensiómetro

Para una comprensión más completa de la medición de la energía superficial, lea nuestra medición de la energía superficial: la guía definitiva

For benchmark contact angle and surface energy values on glass, nylon, PMMA, and Teflon, see the Open Benchmark Data panel above or visit our Dataset Hub for full CSV downloads.

Capítulo 5: Medición del ángulo de deslizamiento

El ángulo de deslizamiento mide el ángulo en el que una película líquida se desliza sobre una superficie sólida. Se emplea comúnmente para evaluar la resistencia al deslizamiento de una superficie.

Ángulo de deslizamiento 1

Sample Image taken from Droplet Lab Tensiometer

Aprenda cómo se realiza la medición del ángulo de deslizamiento en nuestro tensiómetro

Para una comprensión más completa de la medición del ángulo de deslizamiento, lea nuestra medición del ángulo de deslizamiento: la guía definitiva

Capítulo 6: Aplicaciones en el mundo real

Within the Medical Device industry, several case studies exemplify the advantages of conducting surface property measurements.

Improving Urine Glucose µPAD Readability via Engineered Detection Zones and Verified Hydrophobic Barriers

The authors introduce a simple, high-resolution fabrication approach for Parafilm®-laminated µPADs using a three-step Parafilm®-heating–laser-cutting workflow (laminate Parafilm® onto paper via oven heating, then pattern using CO₂ laser ablation). They also present engineered detection-zone geometries (multi-inlet and segmented designs) that significantly improve color uniformity in a model enzymatic glucose colorimetric assay, without chemically modifying the paper. They demonstrate improved gradient reduction, strong calibration in artificial urine across clinically relevant glucose ranges, and successful testing of spiked real human urine samples.

Role of the Droplet Lab Goniometer

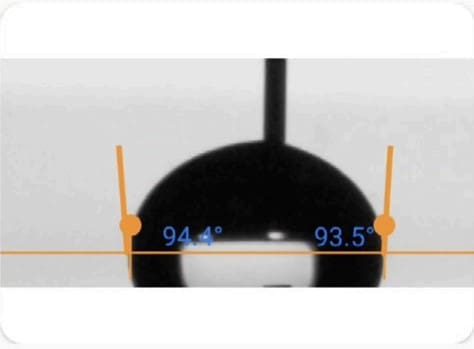
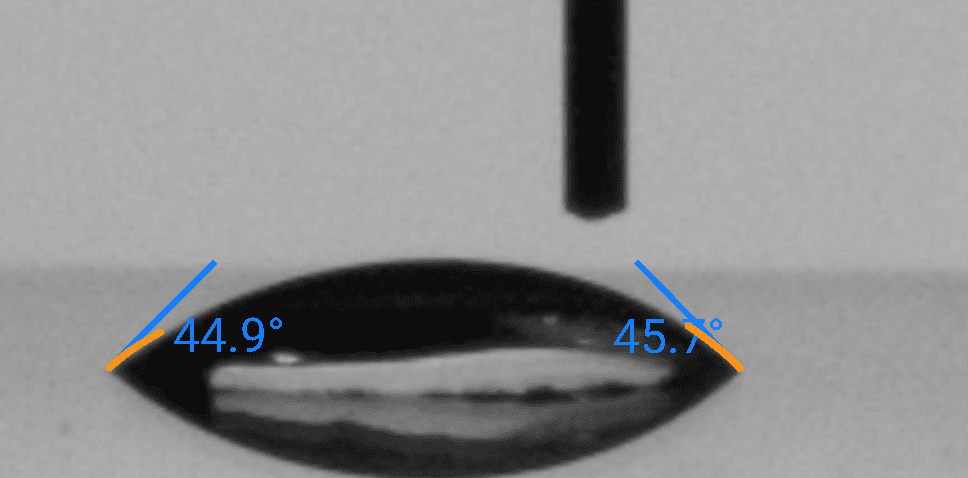
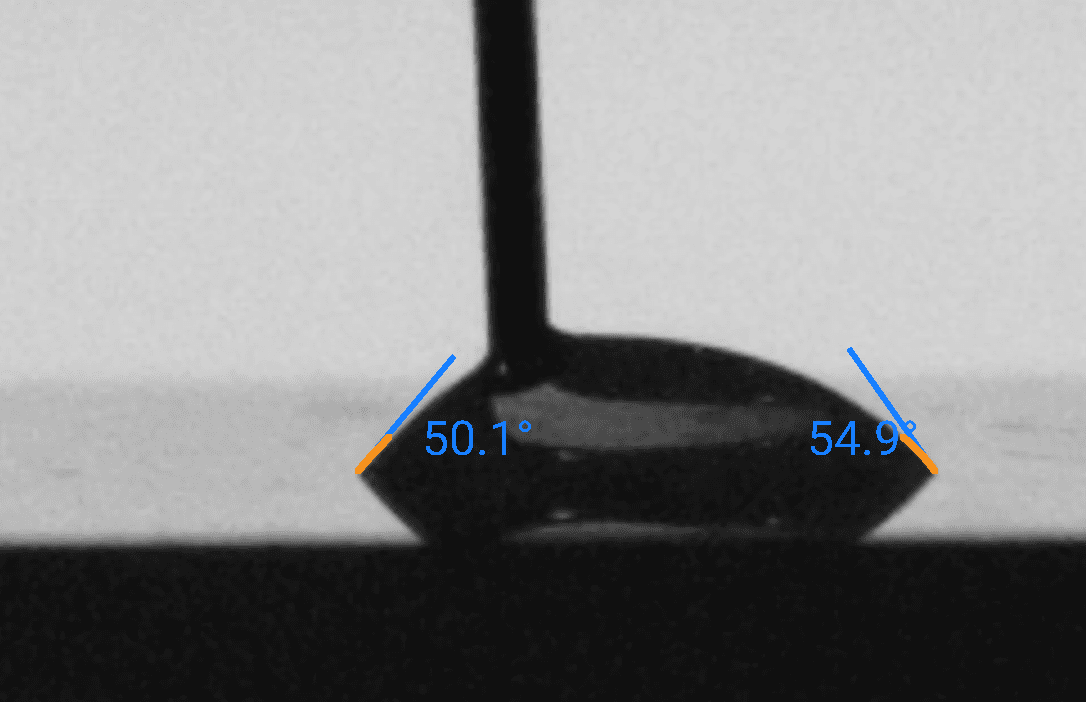
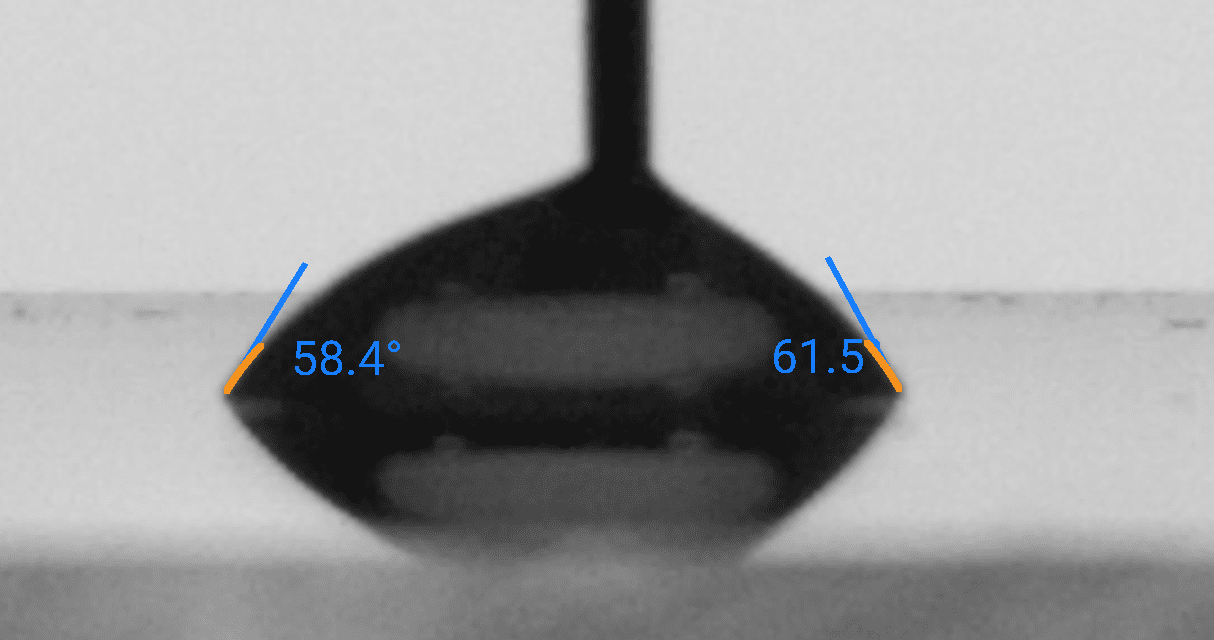
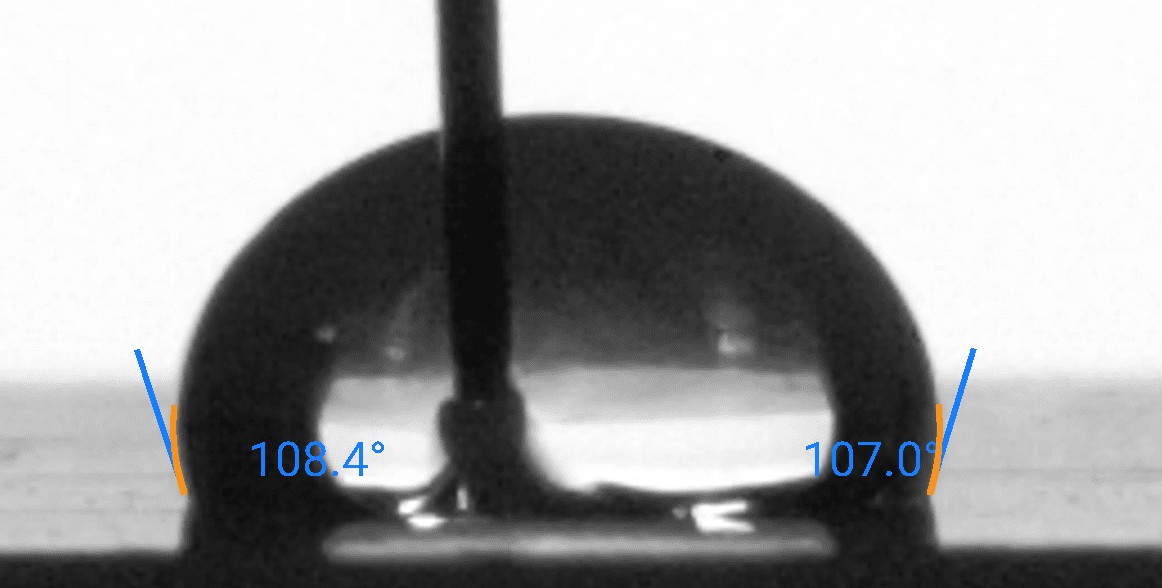
A Droplet Lab Dropometer was used to measure water contact angle to confirm that the hydrophobicity of the Parafilm® layer remained essentially unchanged after the laser ablation step (i.e., the fabrication process did not degrade the barrier’s wettability performance). Specifically:

  • In Methods (Device characterization), the paper states that water contact angle of pristine Parafilm® and the Parafilm® layer after laser ablation of paper was assessed using Dropometer (Droplet Lab).

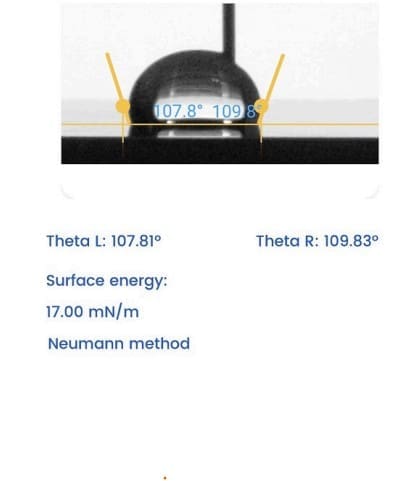
In Results, they report contact angles of ~108° (pristine) vs ~109° (post-ablation), supporting that the PHLC process preserved Parafilm® hydrophobic behavior critical for reliable microfluidic containment.

Key Findings

  • High-resolution laminated µPAD fabrication was achieved with a minimum barrier width of 172 ± 15 µm, enabling compact designs.
  • Engineered detection zones (multi-inlet and segmented) reduced color gradient in the glucose assay from 28.77% (conventional) to 12.35% (multi-inlet) and 8.95% (segmented).
  • The segmented D-zone was selected for analytical validation due to best uniformity and reproducibility.
  • In artificial urine, glucose detection showed excellent curve fits (R² > 0.99) across 2–50 mM, with a reported LOD ~1.65 mM (linear region).
  • Spiked real urine tests (5.5, 7.5, 9.5 mM) produced recoveries roughly ~92–111% with strong precision (reported RSDs <3% for those replicates).

Why it matters

For medical-device-style paper diagnostics, non-uniform color development is a major source of readout variability (especially for phone-camera or visual interpretation). This work shows that geometry alone (engineered detection-zone inlets/segmentation) can substantially improve signal homogeneity, which supports more reliable semi-quantitative interpretation, stronger QC tolerances, and more reproducible manufacturing—without adding chemical surface treatments that complicate scale-up.

Method Snapshot

  • Surface/solid tested (for Droplet Lab measurement): pristine Parafilm® sheet and Parafilm® layer after paper was laser-ablated (exposed Parafilm® region)
  • Droplet: water (reported as water contact angle testing; droplet volume not specified)
  • Temperature: not explicitly stated for contact-angle measurement (device testing commonly at room temperature)
  • Angle type: reported as water contact angle (consistent with static contact angle reporting; advancing/receding not reported)
  • Surface tension: not measured/reported in this study for the contact-angle experiment (water used as the probe liquid)

Data Note

    • Figure 3A (page showing Fig. 3) reports the water contact angle measured using the Droplet Lab Dropometer, comparing pristine Parafilm® (108 ± 5°) vs post-laser-ablation Parafilm® (109 ± 5°).
Figure

Citation (APA Format)

Safiabadi Tali, S. H., Hajimiri, H., Sadiq, Z., & Jahanshahi-Anbuhi, S. (2023). Engineered detection zone to enhance color uniformity on paper microfluidics fabricated via Parafilm®-heating-laser-cutting. Sensors and Actuators B: Chemical, 380, 133324. https://doi.org/10.1016/j.snb.2023.133324

View Publication →

Creating Safer Implantable Medical Devices

A group of experts actively crafts medical devices like stents and catheters for implantation within the human body. Recognizing the crucial role of surface properties in preventing infections, they meticulously study liquid interactions with these surfaces. This in-depth analysis allows them to design surfaces that repel protein adhesion, ultimately reducing the risk of equipment failure and ensuring smoother patient recoveries.

Creating Safer Implantable Medical Devices

Refining Drug Delivery for Better Patient Care

Imagine a team developing advanced drug delivery systems, like patches that administer medication or implants that gradually release drugs. Their secret weapon for making these systems efficient is measuring surface properties. By analyzing how liquids behave on the surface, the team can fine-tune the design to ensure precise drug release and absorption. This innovation increases treatment effectiveness and enhances patient well-being.

Refining Drug Delivery for Better Patient Care

Healing Harmony in Biodegradable Medical Materials

A team is actively developing biodegradable materials for medical use, like sutures and wound dressings. Their goal is to create materials that seamlessly integrate with the body's natural processes. They achieve this by studying how liquids interact with the surface, allowing them to fine-tune the materials for optimal healing and minimal adverse reactions. This meticulous approach leads to medical solutions that not only promote recovery but also naturally break down over time.

Healing Harmony in Biodegradable Medical Materials

Somos sus socios en la resolución de su negocio y tecnología Desafíos

Si está interesado en implementar estas u otras aplicaciones, póngase en contacto con nosotros.

Capítulo 7: Normas y directrices

In an industry where precision reigns supreme, how can Medical Device manufacturers ensure their products withstand scrutiny? The answer lies in standards and guidelines: the compass that guides them through the complex maze of quality and performance.

FDA 510(k) Guidance — Contact Lens Care Products (Chemistry Appendix B): Determination of Critical Micelle Concentration (CMC) by Surface Tension

What it is

FDA-described approach to estimate a surfactant (or surfactant system) CMC by measuring surface tension (γ) across a dilution series prepared in the product/device medium, plotting γ vs log(concentration), and determining the breakpoint via least‑squares linear regression. It is intended to support defensible selection and documentation of surfactant concentration for contact lens care products with cleaning claims.

When to use it

510(k) support for cleaners with surfactants

Use when you need to show the surfactant level is selected with reference to CMC in the actual product medium (not pure water).

In-house formulation/QC control

Use to trend lot-to-lot or batch-to-batch behavior by comparing full γ vs log(C) curves and breakpoint stability over time.

In-scope / Out-of-scope

In scope
  • Preparing a device/product-medium dilution series (medium without surfactants + surfactant system at product ratio, then dilutions).
  • Surface tension measurement at each concentration using a tensiometer (geometry not specified by the guidance).
  • γ vs log(concentration) plotting and least‑squares regression to estimate the CMC breakpoint.
  • Controlling and documenting temperature and medium conditions (e.g., pH/tonicity/inactives) because they materially affect CMC.
Out of scope
  • Mandating a specific tensiometer geometry (ring/plate vs pendant drop equivalence is your validation responsibility).
  • Demonstrating cleaning effectiveness directly (CMC is a supporting characterization metric, not a cleaning test by itself).
  • Comparing CMC values across different media when pH/tonicity/inactives are not controlled and documented.
  • Claims of electronic record compliance / submission acceptability without site validation and quality-system controls.

Minimum you must report (checklist)

  • Solution 1: product/device medium without surfactants (include pH, tonicity, and other relevant inactives).
  • Solution 2: surfactant system identity and ratio(s) (if multiple surfactants) plus starting concentration.
  • Solution 3: dilution series concentrations (explicit list) and preparation scheme (volumes/dilution factor) with lot IDs where applicable.
  • Measurement conditions: temperature setpoint and actual temperature (per point or per run), plus any required inputs (e.g., density if needed for your method).
  • Instrument/method: tensiometer type/geometry (e.g., pendant drop) and key acquisition settings (including any dwell/equilibration time).
  • Data quality rules: fit/acceptance criteria and any re-run rules (e.g., unstable drop, poor fit, out-of-spec temperature).
  • Results table: γ at each concentration with replicates and summary statistic (e.g., mean ± SD) and the number of replicates.
  • Analysis outputs: γ vs log(C) plot, regression approach/ranges used, and the estimated CMC (breakpoint concentration) with units (and uncertainty if required by SOP).

FDA guidance describes an approach; defensibility comes from executing it consistently and documenting method validation, controls, and traceable records under your quality system. Tools like Dropometer can support this workflow by generating a traceable γ vs log(C) dataset and breakpoint fit, but the implementation must be validated and governed by your site controls.

How to interpret results (guardrails)

  • Pre‑CMC vs post‑CMC behavior: expect a decreasing γ region (adsorption) followed by a plateau; the CMC is the regression breakpoint between these regions.
  • Only compare like-with-like: CMC shifts with temperature and medium composition—do not compare runs unless pH/tonicity/inactives and temperature are controlled and recorded.
  • Set internal margins and limits: use the CMC estimate to define product-specific targets (e.g., “surfactant concentration ≥ X× CMC in product medium”) based on your performance/QC evidence.
  • Reject bad points, not just bad curves: rerun concentration points that fail fit/QC gates or input limits, and ensure regression ranges reflect true linear/plateau regions rather than noise.

Ahora te toca a ti

We hope this guide showed you how to apply surface science in the Medical Device industry.

Ahora nos gustaría entregárselo a usted:

Feel free to leave a comment below—we’d love to hear from you.

Contesta

Su dirección de correo electrónico no será publicada. Los campos obligatorios están marcados *