



Contenido
Case Study

A rheology lab put surface tension next to every flow curve, and reported it in seven publications.

Last Updated
November 4, 2026
Industria
Chemical engineering: rheology and colloids research
Location
Waterloo, Ontario, Canada
Instrument access
Paid loan from June 2024
Published with the Dropometer
6 peer reviewed papers and 1 preprint
Image credit
Fig. 11, Sun and Pal, Fluids 10 (2025) 253, CC BY 4.0
Drop shape method validated against a KRÜSS DSA100E in peer review 7 publications from this group report its surface tension data 2 peer reviewed validation papers

Prof. Rajinder Pal's group at the University of Waterloo studies how polymers, surfactants and particles change the way fluids flow. Viscosity showed that something happened at the interface, but not what. A paid loan of a Droplet Lab pendant drop tensiometer, from June 2024, added surface and interfacial tension to the lab, and to seven publications from January 2025 to October 2026.

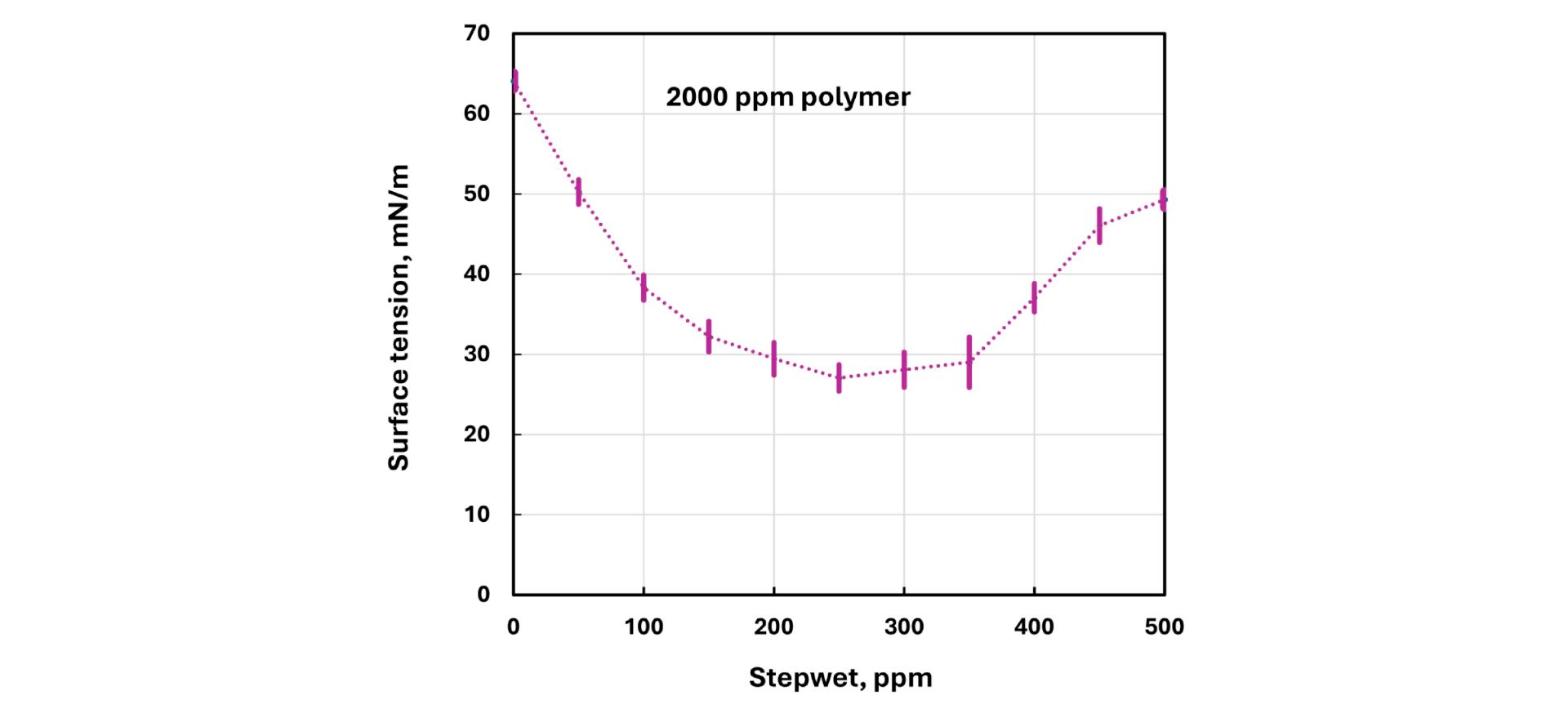
Plot of surface tension against Stepwet surfactant concentration for 2000 ppm cationic polymer: falls from about 64 to a minimum near 27 mN/m at 250 ppm, then rises to about 49 mN/m, with error bars
Abhimanyu Photo
Escrito por
Abhimanyu Bhandankar
Holds an MBA from Schulich School of Business and a BE in IT. He joined Droplet Lab in July 2019 and now leads sales and marketing.
CEO at Droplet Lab
leer más
Gurdeep-Saini-Photo
Technical Review by
Gurdeep Singh Saini
Holds a BASc in Mechanical Engineering from Ryerson University (now Toronto Metropolitan University) and an MASc from York University. He develops the automatic edge and baseline detection behind the Dropometer's analysis.
COO at Droplet Lab
leer más
Abhimanyu Photo
Written By

Abhimanyu Bhandankar

CEO at Droplet Lab

Holds an MBA from Schulich School of Business and a BE in IT. He joined Droplet Lab in July 2019 and now leads sales and marketing.

Gurdeep-Saini-Photo
Reseña escrita por

Gurdeep Singh Saini

COO at Droplet Lab

Holds a BASc in Mechanical Engineering from Ryerson University (now Toronto Metropolitan University) and an MASc from York University. He develops the automatic edge and baseline detection behind the Dropometer's analysis.

Primary outcome: surface tension bottoms out where consistency peaks

Surface tension of a cationic polymer solution as anionic surfactant is added

CHEC at 2000 ppm with SLS, pendant drop, n = 12 per point (Fluids 2025, Table 3)

0 ppm surfactant 64.09 ± 0.98 mN/m
250 ppm surfactant 27.06 ± 1.64 mN/m

With 2000 ppm of a cationic cellulose polymer (CHEC), adding the anionic surfactant SLS lowered surface tension from 64.09 ± 0.98 to a minimum of 27.06 ± 1.64 mN/m at 250 ppm, from 12 readings per point. The consistency index peaked in the same 200 to 300 ppm range. The mixtures stayed well below SLS alone, which the authors attribute to surface active polymer and surfactant complexes. At 3000 and 4000 ppm polymer, no minimum appeared below 500 ppm.

7 publications

Six peer reviewed papers and one preprint, January 2025 to October 2026, with surface tension from the instrument.

10 to 30 readings per sample

Repeat pendant drop readings averaged for each sample, depending on the study.

≤ 3.14 mN/m SD

Largest standard deviation across 11 surfactant levels, 12 readings each (Fluids 2025).

300 ppm vs about 332

HTAB critical micelle concentration from the group's own data, against about 332 ppm in the literature.

Executive Summary

Who

Prof. Rajinder Pal's group in the Department of Chemical Engineering at the University of Waterloo, Ontario. The group studies the rheology of polymer solutions, surfactant mixtures, nanocrystal and silica suspensions, emulsions and protein dispersions, and how what happens at interfaces changes the way these fluids flow.

Problem

Rheology shows that viscosity jumps when a surfactant is added, but not why. The answer sits at the interface, where surfactants bind to polymers and particles. The group wanted surface and interfacial tension alongside its viscometers, but had no capital budget for a tensiometer.

Solución

A paid loan of a Droplet Lab Dropometer, used as a pendant drop tensiometer, from June 2024, after a demo in the lab in May 2024. The papers report 10 to 30 readings per sample with a 1.8 mm needle and a 500 µL gastight syringe, and each drop is fitted with the Young Laplace equation.

Time to Value

September 2019: first email from Droplet Lab. 6 April 2024: paid loan terms agreed, subject to a demo. 3 May 2024: demo in the lab. June 2024: instrument shipped on the paid loan. 29 January 2025: first paper (Polymers). 2 October 2026: seventh publication (Foods).

Results

Seven publications between January 2025 and October 2026, six of them peer reviewed. Surface tension break points marked where surfactants bind, matched jumps in consistency, and gave an HTAB CMC of 300 ppm against about 332 ppm in the literature. Oil and water interfacial tension helped explain when emulsions invert.

Highlights

7

Publications with its surface tension data

6

Peer reviewed papers

5

Fluid systems studied

About 7 months

From shipment to first paper

University of Waterloo, at a glance

Research focus

Rheology and interfacial behaviour of complex fluids: polymer and surfactant solutions, suspensions, emulsions and protein dispersions.

Products / applications

Fundamental work behind formulated fluids; the authors point to uses such as plant based emulsifiers and foam stabilizers for foods.

Measurement stage

Research: surface tension on every formulation in a concentration series, next to viscosity and conductivity.

Users

Prof. Pal and six co-authors across the seven publications, 2025 to 2026.

Materials and surfaces tested

Cellulose ethers, guar and xanthan gums, polyacrylamide, cellulose nanocrystals, fumed silica and zein nanoparticles; anionic, cationic, nonionic and amphoteric surfactants; mineral oil.

Key constraints

No capital budget for a tensiometer at the start; fluids range from water like to strongly shear thinning.

The challenge: rheology showed what happened, not why

Surfactants change viscosity by what they do at interfaces.

Viscosity jumps without an explanation

Add the cationic surfactant HTAB to a nanocrystal or fumed silica suspension and the consistency index can rise 20 to 70 fold (Nanomaterials 2026). In the group's nanocrystal suspension study, it rose more than fivefold at 500 ppm HTAB. Flow curves show that it happens, but not where the surfactant has gone. Our guide to surfactants explains why that answer sits at the interface.

Surfactant binding happens at interfaces

As surfactant binds to polymer chains or particles, the free surfactant left in solution changes, and so does surface tension. Break points mark where binding starts and where the polymer is saturated. The Polymers 2025 study estimated both for two polymers and five surfactants, and the ChemEngineering 2025 study ranked sixteen polymer and surfactant pairs. The same logic underpins CMC assessment and surfactant efficiency testing, with the critical micelle concentration as the reference point. Our classroom experiment on surfactants and surface tension shows the basic curve.

No budget for a new instrument

In April 2024 the group had no funds for a new tensiometer. Prof. Pal planned to apply for a grant only if the instrument proved useful on his own fluids, so he asked for a demonstration and a paid loan first. Labs weighing the same choice can compare options in our tensiometer guide for surfactant and CMC research or try the measurement method selector.

What success would require

Surface tension on every sample in a concentration series, repeated enough times to trust small differences, plus oil and water interfacial tension for the emulsion phase inversion study, all in the lab next to the viscometers. That calls for reproducible surface tension measurement. For surfactant solutions, pendant drop is an equivalent method to the ring and plate tests in ASTM D1331. The same oil and water readings matter for oil and gas fluids, where surfactants are added to drilling and fracturing fluids.

The insight: put surface tension next to every flow curve

What Was Deployed

A Droplet Lab Dropometer contact angle and surface tension kit, used as a pendant drop tensiometer, on a paid loan from June 2024. The papers describe a 1.8 mm stainless steel needle, a 500 µL Hamilton 1750 TPLT gastight syringe with a screw driven plunger, back lighting and a phone camera. Each drop is fitted to the Young Laplace equation in the supplied software, as set out in our surface tension measurement guide. For interfacial tension, a 10 to 20 µL aqueous drop hung inside a sealed quartz cuvette of white mineral oil (Colloids and Interfaces 2025). The Fluids 2025 study reports 12 readings per sample with standard deviations. The papers cite the published method: Chen, Muros-Cobos, Holgado-Terriza and Amirfazli, Colloids and Surfaces A, 2017.
The Origin

No budget for a tensiometer, so a paid loan first

Droplet Lab first emailed Prof. Pal in September 2019. In 2023 he asked about a short loan, but no agreement was reached. In April 2024 he wrote back: a graduate student would start in May on a project that might need surface tension measurements. He asked for a demonstration and, if the instrument worked for his fluids, a loan at a reasonable fee. He had no funds to buy at the time and planned to apply for a grant if the instrument proved useful.

Both sides agreed a paid loan for an initial three month term, extendable. On 3 May 2024 Droplet Lab demonstrated the tensiometer in his lab with the student who would run the work, and the instrument shipped in June 2024 against a university purchase order.

The first paper with its data appeared in Polymers in January 2025. The group renewed the paid loan for each new project term through April 2026 and published six more times, on polymers, suspensions, emulsions and food dispersions.

Decision Rationale

A paid loan before a purchase

Three routes were open in 2023 and 2024.

Option 1

Buy outright

A full instrument purchase from grant funds.

Not possible at the time: no capital budget.
Option 2

Rely on literature values

Use published surface tension and CMC values for each surfactant.

Not chosen: binding in each mixture had to be measured.
Option 3

Paid evaluation loan

A paid loan for an initial term, extendable, after a demo in the lab.

Chosen
The paid loan let the group test the method on its own fluids before any capital request. Seven publications later, the case for the instrument sits in the group's own papers. The trade off is that a loan runs term by term, so each new project needed a new agreement. Its CMC results can be checked against our CMC reference values for common surfactants.

Next Step

Need surface tension next to your rheology data?

A pendant drop series shows where surfactants bind, saturate and form micelles, at the same concentrations as your flow curves. The Dropometer measures surface tension, interfacial tension, contact angle and surface energy in one portable kit, with a drop shape method validated against a KRÜSS DSA100E in peer review. Setup takes about 2 minutes. Book a 15-minute consult about your fluids.

Before vs After

Metric Before After
Surface tension in the lab No tensiometer of its own and no funds to buy one (April 2024) Paid loan from June 2024, read beside viscosity and conductivity
Where surfactant binds to polymer Not measurable in the lab Approximate CAC and PSP break points for 2 polymers and 5 surfactants (Polymers 2025)
HTAB critical micelle concentration Literature value, about 332 ppm Measured 300 ppm from surface tension and conductivity (Nanomaterials 2026)
Oil and water interfaces Not measurable in the lab 57.2 mN/m without surfactant to 3.02 mN/m with 1 wt% SDS (Colloids and Interfaces 2025)
Repeat readings per sample Not applicable 10 to 30 per sample, averaged; standard deviation up to 3.14 mN/m (Fluids 2025)
Publications with its data None 7, January 2025 to October 2026

Rollout timeline

Timeline (high level)

2019 to 2023: First contact

  • Droplet Lab first emails Prof. Pal in September 2019
  • In 2023 he asks about a short loan; no agreement is reached

April to June 2024: Demo and paid loan

  • Paid loan terms agreed on 6 April 2024, subject to a demo
  • On site demo in the lab on 3 May 2024
  • University purchase order issued and instrument shipped in June 2024

January to July 2025: First papers

  • Polymers (29 January): surfactant binding in two polymers with five surfactants, 12 readings per sample
  • Colloids and Interfaces (11 July): surface and oil and water interfacial tension in emulsion phase inversion
  • Preprint (25 July): HTAB with cellulose nanocrystals, 30 readings per sample

September 2025: Polymer and surfactant series

  • ChemEngineering (23 September): 16 polymer and surfactant pairs
  • Fluids (27 September): surface tension minimum of 27.06 ± 1.64 mN/m where the consistency index peaks

2026: Suspensions and food dispersions

  • Nanomaterials (28 May): CMC of 300 ppm for HTAB from surface tension and conductivity
  • Foods (2 October): zein nanoparticles lower surface tension in polysaccharide dispersions, at least 15 readings per sample

2024 to 2026: Paid loan renewed

The paid loan was renewed for each new project term through April 2026

Proof and validation: what the papers show, and what they do not

Test method

Pendant drop surface tension in air, fitted with the Young Laplace equation from a phone camera image, at room temperature (22 ± 1 °C where stated). Interfacial tension: a 10 to 20 µL aqueous drop in white mineral oil inside a sealed quartz cuvette. Foods 2026 let each drop settle for 1 to 3 minutes before capture.

Sample size and operators

10 to 30 readings per sample, depending on the paper: 12 in Polymers and Fluids, 10 in Colloids and Interfaces, at least 13 in Nanomaterials, at least 15 in Foods and 30 in the preprint. ChemEngineering says multiple times. Operators are not reported.

Repeatability / reproducibility

Fluids 2025 reports standard deviations of 0.97 to 3.14 mN/m across 11 surfactant levels, 12 readings each, and the authors call the spread small. Nanomaterials 2026 gives a worked example: 13 readings with a mean of 50.97 mN/m and a standard deviation of 1.18 mN/m.

Notes / assumptions

No water calibration value is reported, and drop volume is given only for interfacial tension (10 to 20 µL). Only Foods 2026 states a settling time. Most values appear only in plots. The preprint is not peer reviewed. ChemEngineering and Fluids share a polymer system and one data table, so they are related studies. The papers credit the instrument to Droplet Lab without using the product name.

Outcomes to date

Measured Outcomes

64.09 to 27.06 mN/m

Surface tension minimum where consistency peaks

Cationic polymer at 2000 ppm with anionic SLS, 12 readings per point. The minimum at 250 ppm falls in the 200 to 300 ppm range where the consistency index peaks (Fluids 2025).

57.2 to 3.02 mN/m

Oil and water interfacial tension with SDS

White mineral oil and water, 10 readings per solution. Cellulose nanocrystals alone lowered it only to 38.3 mN/m; the authors credit their effect on inversion to interfacial jamming (Colloids and Interfaces 2025).

300 ppm

HTAB CMC from the group's own data

Against about 332 ppm in the literature. Break points of 229 and 352 ppm with 2 and 5 wt% fumed silica matched jumps in rheology (Nanomaterials 2026).

Operational Outcomes

Emulsion inversion delayed

Cellulose nanocrystals moved the inversion point of water in oil emulsions from 0.253 to 0.545 aqueous volume fraction, tracked by conductivity (Colloids and Interfaces 2025).

Thickening explained

With HTAB at high concentrations, nanocrystal and fumed silica suspensions showed a 20 to 70 fold rise in consistency index. Break points in surface tension and conductivity marked where it began (Nanomaterials 2026).

Interaction strength ranked

Sixteen polymer and surfactant pairs were classified by interaction strength using rheology and surface tension together (ChemEngineering 2025).

What's next

Delivered

Seven publications on polymers, suspensions, emulsions and food dispersions (2025 to 2026)
Measured CMC and binding break points for common surfactants
Oil and water interfacial tension for emulsion phase inversion

In Pilot

Contributing the group's surface tension data to an open dataset paper (under discussion, October 2026)

Planned

Dynamic surface tension of zein dispersions, which the authors recommend as future work

Frequently asked questions

Can I try a Dropometer before buying it?

This group did. With no capital budget for a tensiometer, the University of Waterloo lab took a paid loan from June 2024, after a demo in its own lab in May 2024. It renewed the loan for each new project term.

Why measure surface tension alongside rheology?

Viscosity shows that something happens when a surfactant is added, but not why. Surface tension break points mark where surfactants bind to polymers and particles. The group measured an HTAB CMC of 300 ppm against about 332 ppm in the literature.

How many publications report the group's surface tension data?

Seven between January 2025 and October 2026, six of them peer reviewed. They cover polymers, surfactant mixtures, suspensions, emulsions and food dispersions, with oil and water interfacial tension for the emulsion study.

Next Step

Need surface tension next to your rheology data?

A pendant drop series shows where surfactants bind, saturate and form micelles, at the same concentrations as your flow curves. The Dropometer measures surface tension, interfacial tension, contact angle and surface energy in one portable kit, with a drop shape method validated against a KRÜSS DSA100E in peer review. Setup takes about 2 minutes. Book a 15-minute consult about your fluids.